Energy Cost Benchmarking For IT Departments
Learn how IT leaders use structured energy cost benchmarking to identify waste, set performance targets, and drive measurable reductions in PC fleet power spend — without disrupting operations.
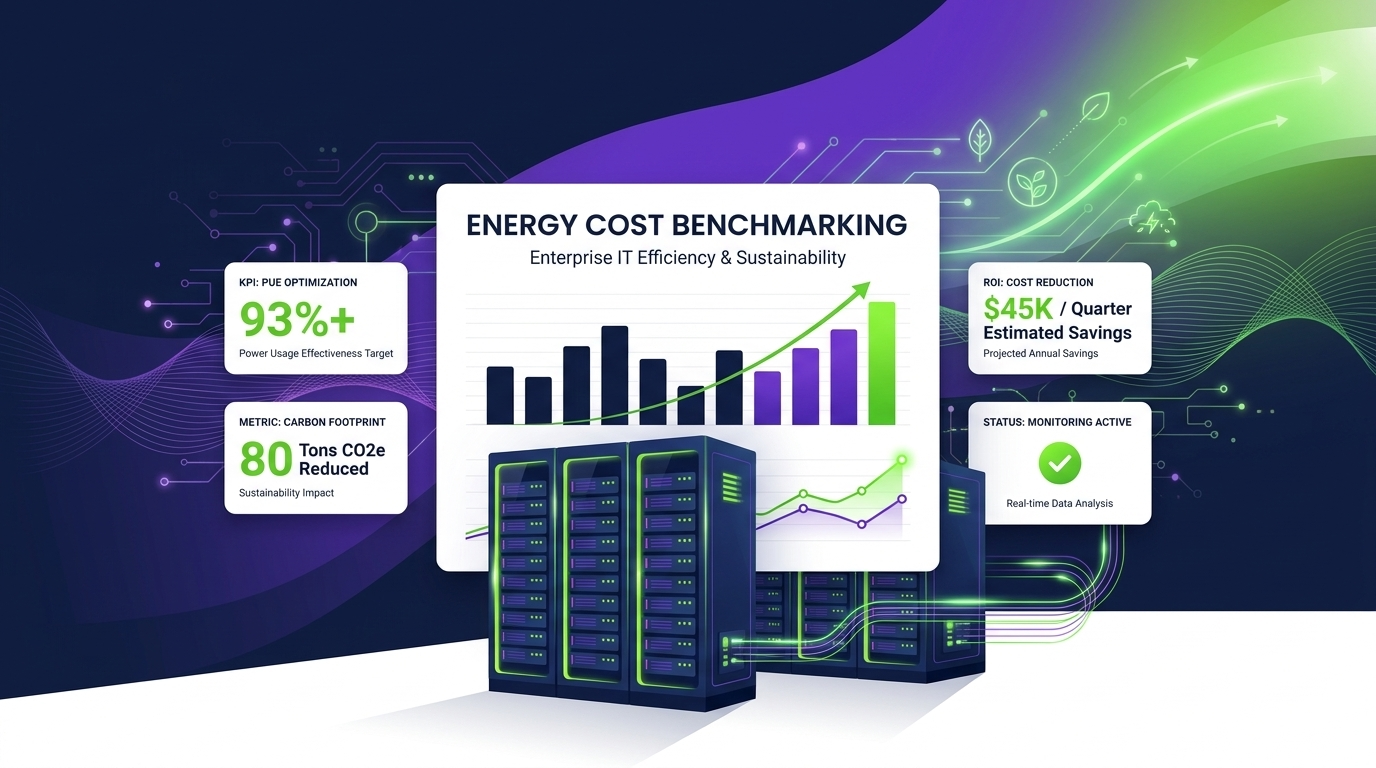
Energy cost benchmarking is rapidly becoming a core competency for enterprise IT departments. As organizations face mounting pressure to reduce carbon footprints, control operational spending, and demonstrate ESG accountability, the ability to measure, compare, and continuously improve PC fleet energy consumption is no longer optional — it is a strategic imperative. This guide walks through the frameworks, reference data, tooling, and best practices IT leaders need to turn energy benchmarking from a one-time audit into a continuous efficiency engine.
Article Navigation Table of Contents
- Why IT Energy Benchmarking Matters Now
- Industry Standard Energy Costs and Normalization
- Comparing IT Energy Benchmarks: A Reference Table
- Building Your Benchmarking Framework
- From Manual Spreadsheets to Continuous Benchmarking
- How PowerPlug Supports IT Energy Cost Benchmarking
- Common Pitfalls and How to Avoid Them
- Frequently Asked Questions
- Benchmarking PC energy costs requires normalizing consumption data by fleet size, device type, usage hours, and local electricity tariffs before comparisons are meaningful.
- Industry reference ranges vary widely — unmanaged fleets typically consume 40–80% more energy per endpoint than optimized peers.
- Effective benchmarking programs combine automated data collection, defined KPIs, and regular review cycles tied to business planning.
- Automated power management platforms like PowerPlug close the loop between benchmark insight and real-time corrective action.
- Benchmarking output feeds directly into ESG reporting, sustainability disclosures, and IT budget justification for energy initiatives.
Why IT Energy Benchmarking Matters Now
Enterprise IT departments have historically tracked energy as a data-center concern — cooling, servers, UPS systems. End-user computing was treated as a fixed overhead. That assumption is now being challenged by three converging forces.
Regulatory and ESG Pressure
Mandatory sustainability reporting requirements — including the EU Corporate Sustainability Reporting Directive (CSRD) and SEC climate disclosure rules — demand granular Scope 2 emissions data. PC fleets, which can represent 20–35% of an organization’s total electricity consumption, can no longer be reported as a black box. Auditors and investors expect verifiable energy metrics at the asset level.
Rising Electricity Costs
Commercial electricity prices in Europe and North America have risen significantly over recent years, and volatility is expected to continue. For a 10,000-endpoint fleet consuming an estimated 600–900 kWh per PC annually in unmanaged conditions, a 10% tariff increase translates to hundreds of thousands of dollars in additional annual spend. Benchmarking identifies where that spend is concentrated and where it can be cut.
The Hidden Scale of PC Power Waste
Studies consistently show that a large proportion of workstations and laptops are left powered on — or in shallow sleep states — outside active working hours. Without measurement, this waste is invisible. Benchmarking makes it visible, quantifiable, and addressable. Organizations that have deployed structured benchmarking programs report discovering that 40–60% of their PC fleet’s energy consumption occurs outside productive working hours.
Industry Standard Energy Costs and Normalization
Raw electricity consumption figures are not useful for benchmarking unless they are normalized. A raw kWh figure for a 500-seat office means nothing without context: How many devices? What device types? How many hours per day? What is the local electricity tariff?
The Core Normalization Formula
A robust per-endpoint energy cost benchmark is typically expressed as:
Each variable matters. A desktop PC drawing 120W and a laptop drawing 15W in the same fleet cannot be treated identically. Operating hours must reflect actual powered-on time — not assumed working hours. And tariff rates vary dramatically by region, time-of-use plan, and contract type.
Device Type Segmentation
Effective normalization requires segmenting the fleet by device category. Typical consumption ranges per device type in managed enterprise environments:
- Desktop PCs (standard): 60–200W active; 2–6W in managed sleep
- All-in-One desktops: 40–120W active; 1–3W in managed sleep
- Laptops: 10–65W active; 0.5–1.5W in managed sleep
- Workstations (high-performance): 150–450W active; 5–10W in managed sleep
- Thin clients: 5–15W active; under 1W in managed sleep
Operating Hours: The Most Underestimated Variable
Most organizations assume PCs operate for standard business hours — roughly 2,000 hours per year. Actual telemetry data from enterprise deployments routinely reveals that unmanaged endpoints are powered on for 4,000–7,000 hours annually. The gap between assumed and actual operating hours is typically the single largest source of energy cost overestimation-gap in benchmark calculations, and closing it requires real endpoint telemetry, not estimates.
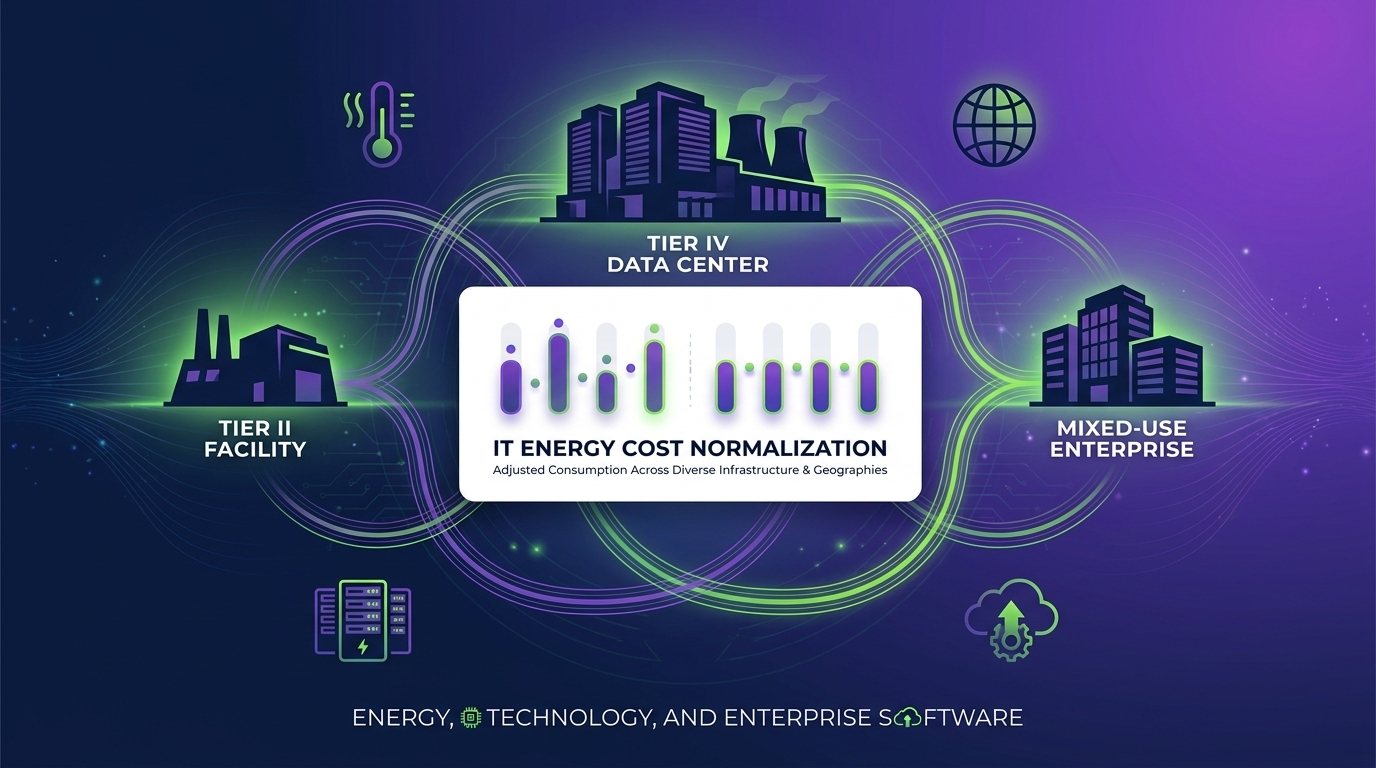
Tariff Normalization for Multi-Region Fleets
Organizations with offices across multiple countries or U.S. states face dramatically different electricity tariffs. A useful approach is to express consumption in kWh per endpoint per year as the primary metric, and then apply region-specific tariff multipliers to arrive at cost figures. This allows meaningful performance comparisons across geographies without conflating energy efficiency with tariff variation.
Comparing IT Energy Benchmarks: A Practical Reference Table
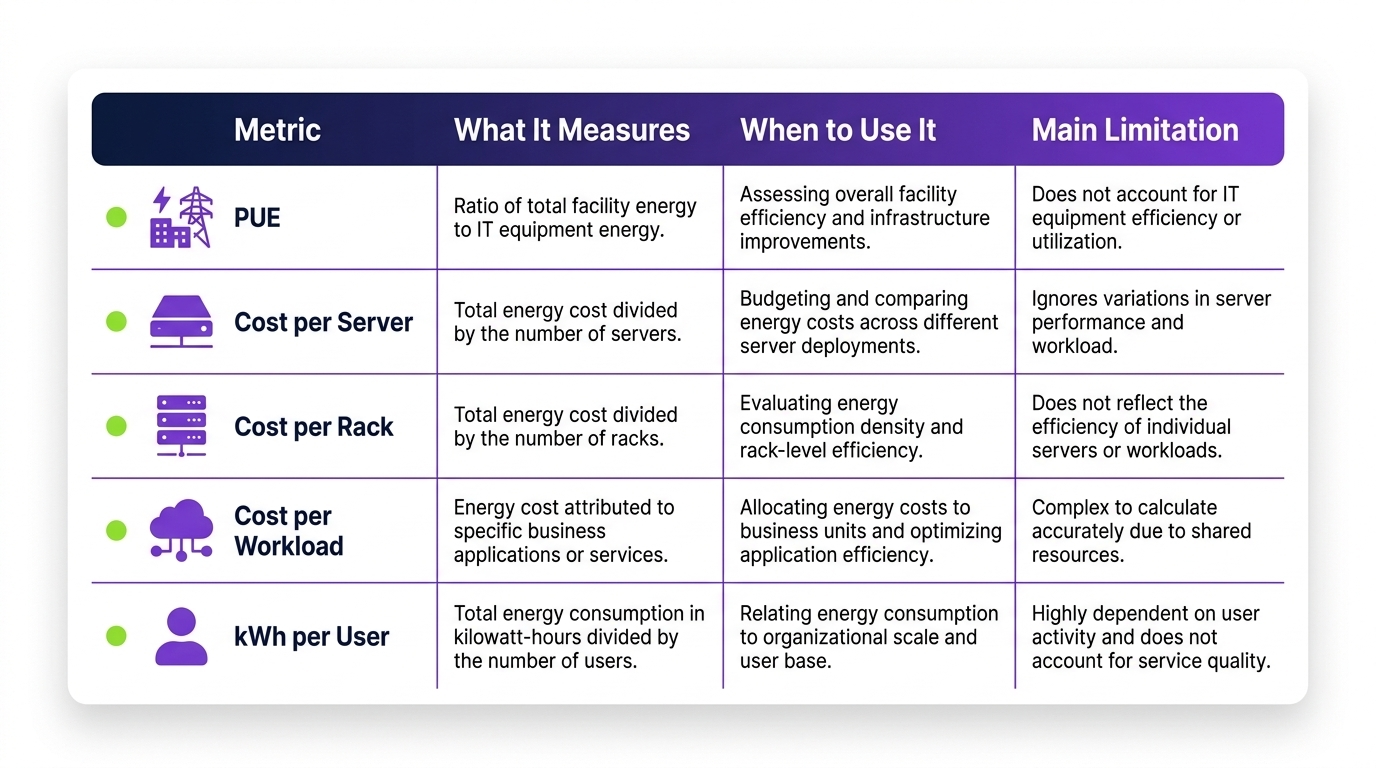
The following reference ranges reflect aggregated data from enterprise IT deployments and published industry research. They are illustrative starting points; your organization’s specific baseline will depend on fleet composition, usage patterns, and geographic factors.
| Benchmark Category | Unmanaged Fleet | Partially Managed | Fully Optimized |
|---|---|---|---|
| Annual kWh per desktop endpoint | 600–900 kWh | 350–600 kWh | 150–350 kWh |
| Annual kWh per laptop endpoint | 150–300 kWh | 80–150 kWh | 30–80 kWh |
| Annual cost per desktop (at $0.15/kWh) | $90–$135 | $53–$90 | $23–$53 |
| % of consumption outside business hours | 40–65% | 20–40% | Under 5% |
| Sleep/hibernate compliance rate | Under 30% | 30–65% | Over 90% |
| Power policy enforcement rate | Under 20% | 40–70% | Over 95% |
| CO₂e per endpoint per year (avg. grid) | 250–400 kg | 140–250 kg | 60–140 kg |
How to Use This Table
Start by placing your fleet in the appropriate column based on current policy enforcement and measured operating hours. If you do not yet have measured data, the unmanaged column is the safest starting assumption. The gap between your current position and the “Fully Optimized” column represents your maximum addressable savings opportunity — the business case for investment in structured power management.
See Where Your Fleet Stands
PowerPlug provides real-time endpoint energy telemetry and automated benchmarking dashboards — so you can move from estimates to verified, auditable data within days of deployment.
Building Your Benchmarking Framework
A structured benchmarking framework turns one-time measurement into an ongoing operational discipline. The following five-stage model reflects best practices observed in enterprise IT organizations that have moved beyond ad hoc energy audits.
Stage 1 — Establish a Baseline
Before any comparison is possible, you need a current-state snapshot. This requires collecting actual power consumption data at the endpoint level, not building-level smart meter readings. Endpoint-level telemetry captures device state (active, idle, sleep, off), duration in each state, and where available, wattage draw. Many organizations discover significant gaps between assumed and actual device behavior at this stage.
Stage 2 — Define Peer Groups and KPIs
Not all endpoints are comparable. Define peer groups by device type (desktop, laptop, workstation), business function (office worker, developer, call center), and location (region, office, remote). Select two to four KPIs per peer group. Common choices include: annual kWh per endpoint, sleep compliance rate (percentage of endpoints entering managed sleep within a defined idle window), and percentage of consumption outside business hours.
Stage 3 — Set Targets
Targets should be realistic, time-bound, and tied to business outcomes. A newly-benchmarked fleet with 30% sleep compliance should not set a target of 95% within 30 days — change management and policy rollout take time. A phased approach with quarterly milestones is more sustainable and easier to communicate to executive stakeholders. Reference the benchmark table above to understand what “fully optimized” looks like as an aspirational target.
Stage 4 — Implement and Enforce Policies
Benchmarking without action creates data without value. Once targets are set, power policies must be actively pushed to endpoints and enforced. This is where many manual approaches break down: spreadsheet-based programs cannot enforce anything. Automated policy management ensures that settings survive user changes, OS updates, and device replacements.
Stage 5 — Review, Report, and Iterate
Benchmarking is a cycle, not a project. Schedule quarterly reviews against KPIs, identify outlier devices or groups, and use the data to refine policies. Annual reviews should feed into sustainability reports, IT budget planning, and asset refresh decisions. Organizations that close this loop consistently are the ones that sustain energy reductions year over year rather than experiencing rebound effects.
From Manual Spreadsheets to Continuous Benchmarking
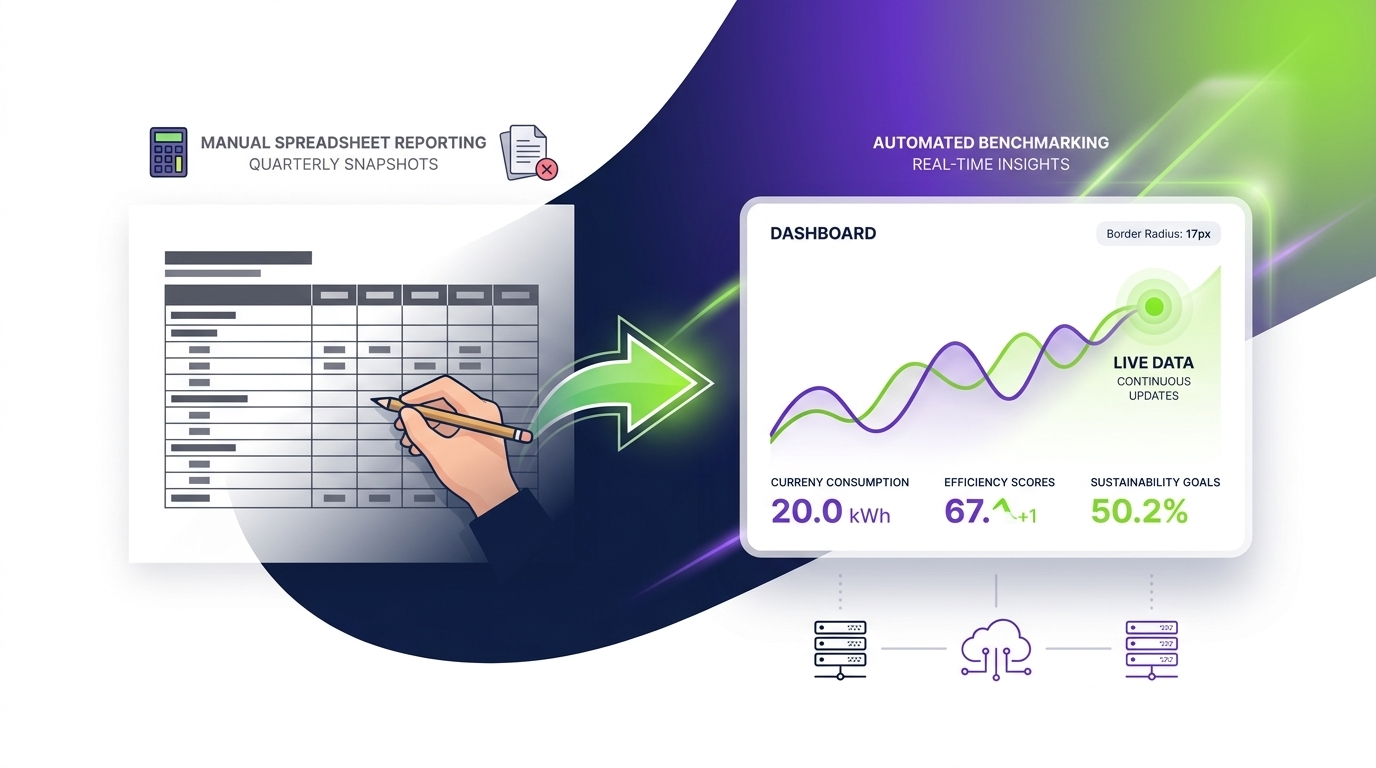
Many IT departments begin their energy benchmarking journey with manual approaches: spreadsheets, periodic audits, and estimates based on device specifications. While these approaches generate useful awareness, they have fundamental limitations that prevent them from delivering sustained value.
Limitations of Manual Approaches
- Static snapshots: Manual audits capture a point in time. Energy behavior changes constantly as device usage, policies, and fleet composition evolve.
- Reliance on estimates: Without endpoint telemetry, organizations default to manufacturer TDP ratings or generic industry averages — neither of which reflects actual operational behavior.
- No enforcement capability: A spreadsheet can identify that sleep compliance is low, but it cannot fix it. The gap between insight and action requires human intervention for every change.
- Scalability limits: A fleet of 500 devices might be manageable manually. A fleet of 5,000 or 50,000 devices is not.
- Reporting overhead: Manually compiling energy reports for ESG disclosures or executive reviews is time-intensive and error-prone.
What Continuous Benchmarking Looks Like
Continuous benchmarking platforms collect endpoint telemetry in real time, automatically normalize data against fleet segments and tariff inputs, compare performance against defined targets, and surface anomalies — all without requiring manual intervention. This shifts the IT team’s role from data collection to data interpretation and strategic decision-making.
Key capabilities that distinguish continuous benchmarking platforms from manual approaches include automated policy enforcement (ensuring settings persist across device restarts and user changes), real-time compliance dashboards, anomaly detection (flagging devices that fall outside expected consumption bands), and audit-ready reporting for sustainability disclosures.
How PowerPlug Supports IT Energy Cost Benchmarking
PowerPlug is an enterprise PC power management platform designed to address precisely the challenges outlined in this guide. It combines endpoint telemetry, automated policy enforcement, and benchmarking analytics into a single integrated solution.
Real-Time Endpoint Telemetry
PowerPlug collects granular device-state data across the entire fleet — active, idle, sleep, hibernate, and off — at configurable intervals. This telemetry forms the foundation for accurate benchmarking: actual measured behavior rather than assumptions or estimates. Consumption data is normalized automatically by device type, usage hours, and where tariff data is provided, by local electricity cost.
Automated Policy Enforcement
PowerPlug pushes and enforces power policies across all managed endpoints. Policies survive user overrides, OS updates, and device replacements. IT administrators can define policies by device group, business unit, or location — and can adjust them dynamically in response to benchmark data without touching individual machines.
Benchmarking Dashboards and Reporting
The platform provides pre-built and configurable dashboards that display KPIs aligned with the benchmarking framework described in this guide: kWh per endpoint, sleep compliance rate, out-of-hours consumption, cost savings versus baseline, and CO₂e reduction. Reports can be exported in formats suitable for executive presentations, sustainability disclosures, and auditor review.
Continuous Improvement Loop
PowerPlug’s anomaly detection surfaces devices or groups that are underperforming against targets — allowing IT teams to investigate and remediate without waiting for a quarterly review cycle. This continuous feedback loop is what transforms benchmarking from a periodic exercise into an operational discipline that delivers compounding savings over time.
Common Pitfalls and How to Avoid Them
Even well-intentioned benchmarking programs can fail to deliver value if they fall into predictable traps. The following are the most common pitfalls observed in enterprise IT energy benchmarking initiatives — and the mitigations that experienced practitioners apply.
Pitfall 1 — Benchmarking Without a Baseline
Some organizations jump straight to peer benchmarks without first establishing their own baseline. Industry reference ranges are useful for orientation, but they cannot substitute for measured fleet data. Without a documented baseline, it is impossible to demonstrate progress — or to make a credible business case for continued investment. Always measure before you compare.
Pitfall 2 — Treating All Devices as Equivalent
Averaging energy data across a mixed fleet of desktops, laptops, and workstations produces metrics that are too blended to be actionable. A fleet-wide average that looks acceptable may conceal a segment of high-consumption workstations that are significantly out of line with their peer group. Segmentation is not optional — it is essential for accurate diagnosis.
Pitfall 3 — Focusing Only on Active Power
Active-state power consumption is the most visible metric, but out-of-hours and idle consumption often represent the largest savings opportunity. An organization that reduces active draw by 10% while leaving 50% of fleet consumption occurring outside business hours has optimized in the wrong place. Benchmarking programs must capture full 24-hour consumption profiles.
Pitfall 4 — Ignoring User Behavior and Change Management
Energy policies that conflict with user workflows will be circumvented. Sleep settings that wake from the wrong trigger, or shutdown policies that interrupt overnight processes, create user pushback that erodes policy compliance. Effective benchmarking programs include user communication strategies and test cohorts before fleet-wide rollout of new policies.
Pitfall 5 — Annual-Only Review Cycles
Annual energy audits capture a snapshot that is already outdated before it is analyzed. Fleet composition changes, tariffs shift, remote working patterns evolve, and OS updates can silently reset power settings. Monthly or quarterly benchmarking reviews — enabled by automated platforms — catch drift before it compounds into significant cost overruns.
Pitfall 6 — No Governance or Ownership
Energy benchmarking programs without a named owner and defined governance structure tend to fade after the initial enthusiasm. Assign responsibility, build review cycles into team calendars, and tie energy KPIs to performance objectives where appropriate. Treat energy as a managed IT asset, not an afterthought.
Ready to Benchmark Your PC Fleet’s Energy Costs?
PowerPlug gives IT departments the telemetry, automation, and reporting they need to turn energy benchmarking from a periodic audit into a continuous competitive advantage. Start with a personalized assessment of your fleet’s savings potential.
Frequently Asked Questions
What is energy cost benchmarking in the context of IT?
IT energy cost benchmarking is the process of measuring your organization’s PC fleet electricity consumption, normalizing that data by fleet size, device type, usage hours, and local tariffs, and then comparing the result against internal historical data or external industry reference ranges. The goal is to identify where consumption is above efficient norms and quantify the savings opportunity of closing that gap.
How much energy does an average enterprise desktop PC consume per year?
This varies significantly based on device age, usage patterns, and power management settings. In unmanaged fleets, desktop PCs commonly consume 600–900 kWh per year. In fully optimized fleets with automated power management, the same devices typically consume 150–350 kWh annually. Laptops consume considerably less — typically 30–300 kWh depending on management status.
Can we benchmark energy costs without installing additional software?
Limited benchmarking is possible using building-level smart meter data divided by estimated device counts, but this approach produces estimates with significant margin of error. It does not support device-level segmentation, cannot distinguish active from idle consumption, and provides no enforcement capability. Endpoint telemetry software is required to produce benchmarks accurate enough to drive meaningful business decisions and auditable sustainability reporting.
How do we account for remote and hybrid workers in our benchmarking?
Remote workers add complexity because their consumption occurs outside the organization’s utility account — typically on residential tariffs that vary by employee location. The recommended approach is to track endpoint power-on hours and consumption via telemetry regardless of device location, express consumption in kWh per endpoint, and apply appropriate tariff factors for cost calculations. Some organizations choose to report remote endpoint consumption separately for clarity in sustainability disclosures.
How often should we review our energy cost benchmarks?
Best practice is quarterly benchmarking reviews with monthly monitoring of key compliance KPIs such as sleep compliance rate and out-of-hours consumption percentage. Annual reviews aligned with budget cycles should include full benchmark recalculation, target resetting, and sustainability reporting. Automated platforms make higher-frequency monitoring practical without adding significant administrative overhead to the IT team.
How does energy benchmarking support ESG reporting?
PC fleet energy consumption contributes to an organization’s Scope 2 greenhouse gas emissions — electricity consumed in operations. ESG frameworks including GRI, TCFD, and CDP, as well as regulatory requirements such as the EU CSRD, require organizations to report and verify these emissions. Accurate endpoint-level benchmarking provides the granular, auditable data that supports credible emissions calculations and demonstrates year-over-year progress — both for internal governance and external disclosure.