
PC Energy Cost Calculator for Business: How to Calculate and Optimize Computer Electricity Costs
Stop guessing what your PC fleet costs to run. This guide shows exactly how to use a PC energy cost calculator for business — and how to slash those costs with automated power management.
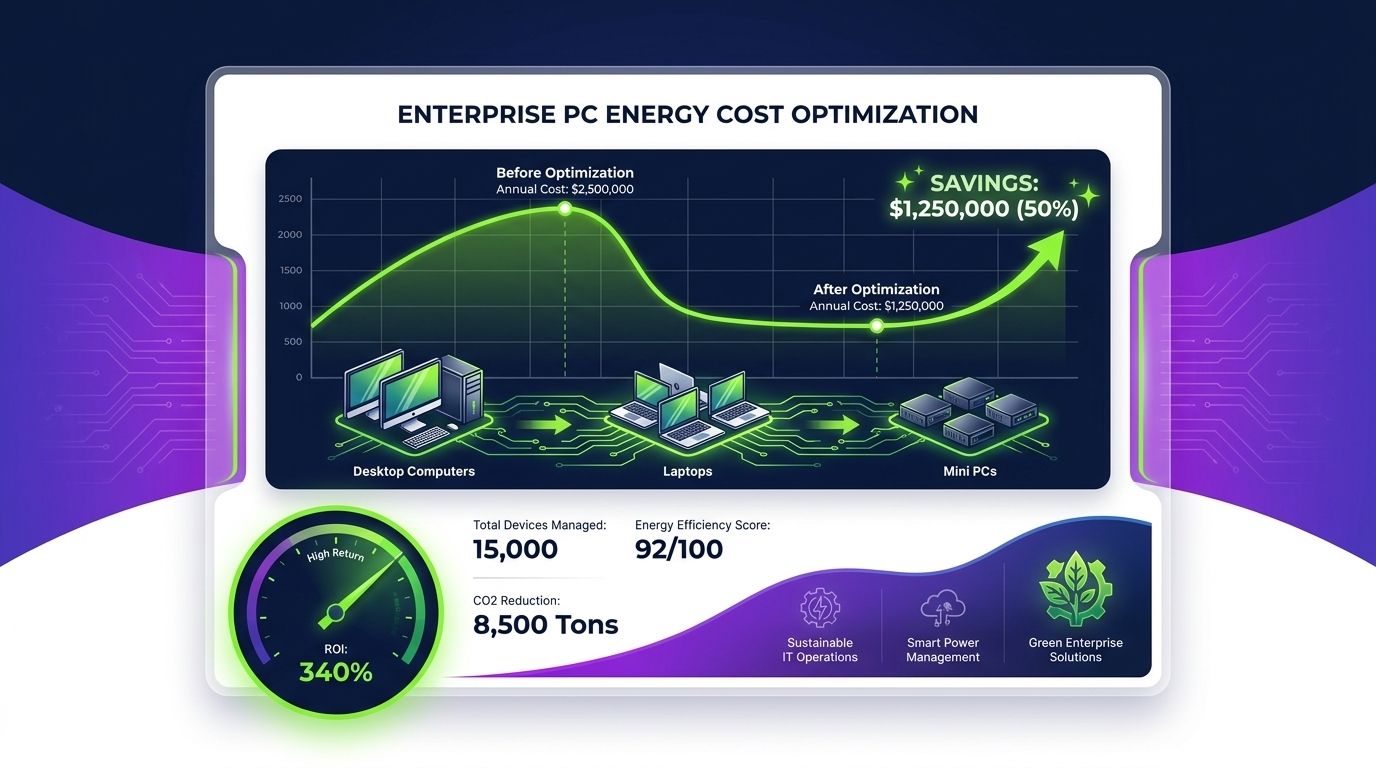
Every business with a PC fleet is paying an energy bill it has never fully scrutinized. A PC energy cost calculator for business turns vague electricity invoices into precise, actionable numbers — revealing exactly how much each computer, each department, and each idle overnight hour costs your organization. This guide walks through the full calculation methodology, common cost drivers, and the technology that converts those savings from theory into practice.
- A PC energy cost calculator for business multiplies wattage, daily usage hours, and local electricity rates to produce accurate per-device and fleet-wide cost figures.
- Desktops left on overnight or at idle can waste 60–80% of their daily energy draw with zero productive output.
- Different device types — desktops, laptops, thin clients, workstations — vary dramatically in consumption; knowing which you own changes the calculation entirely.
- Automated power management software enforces policies at scale, closing the gap between calculated targets and real-world savings.
- Organizations routinely achieve ROI within weeks of deploying a power management solution across fleets of 200 or more endpoints.
- Carbon reduction and ESG reporting are measurable by-products of the same data you use for cost optimization.
Article Navigation Table of Contents
- Why Calculating PC Energy Costs Matters
- How a PC Energy Cost Calculator Works
- Energy Use by Device Type
- Hidden Cost Drivers in Your Fleet
- Scaling the Calculation to a Full Fleet
- Optimization Strategies After You Calculate
- The Role of PC Power Management Software
- Carbon Footprint and ESG Reporting
- Frequently Asked Questions
Why Calculating PC Energy Costs Matters for Business
Most IT and finance teams can tell you what they pay per kilowatt-hour. Very few can tell you what their PC fleet costs to run annually — or which departments are responsible for the largest share. That information gap is expensive.
When organizations finally run the numbers, the results are consistently sobering. A standard business desktop running at 100–150 W, left on for 12 hours a day (including idle periods), draws roughly 450–650 kWh per year. At a commercial electricity rate of $0.12–$0.18 per kWh, that translates to $54–$117 per device per year — before accounting for peripheral devices, monitors, or servers.
Multiply that figure across a fleet of 500 endpoints and you are looking at $27,000–$58,500 in annual electricity spend, a material operating expense that is almost entirely manageable with the right policies in place.
The Business Case in Three Lines
Energy costs are a controllable operational expense. PC fleets consume energy continuously, including during evenings, weekends, and holidays when no productive work is happening. Identifying and eliminating that waste is one of the fastest-returning investments available to IT and facilities teams.
How a PC Energy Cost Calculator for Business Works
The core formula is straightforward. The complexity — and the value — lies in applying it accurately at scale.
The Core Formula
Annual energy cost per device = (Wattage × Daily Hours On ÷ 1,000) × 365 × Local Rate ($/kWh)
Breaking that down:
- Wattage: Actual power draw in the relevant operating state (active, idle, sleep, hibernate, off).
- Daily Hours On: Total hours per day the device is in each state, not just hours of active user work.
- Local Rate: Your actual commercial electricity tariff, which may include demand charges, time-of-use pricing, and taxes.
A Worked Example
| Parameter | Value | Notes |
|---|---|---|
| Device type | Business desktop | Mid-range CPU, no discrete GPU |
| Active power draw | 85 W | Measured under typical office workload |
| Idle power draw | 45 W | Logged in, no active user task |
| Hours active per day | 7 h | Average productive hours |
| Hours idle per day | 9 h | Before/after work, lunch, meetings |
| Hours powered off | 8 h | Overnight (if policy enforced) |
| Electricity rate | $0.14 /kWh | Typical US commercial rate |
| Annual cost (no policy) | $98.37 | 7h active + 9h idle + 8h on overnight at 45 W |
| Annual cost (power policy) | $38.62 | 7h active + 2h idle, remainder in sleep/off |
| Annual saving per device | $59.75 | ~61% reduction |
The numbers above use conservative assumptions. Organizations with older hardware, heavier workloads, or less disciplined overnight shutdowns will see even wider gaps between baseline and optimized cost.
Energy Use by Device Type: What Your Fleet Actually Draws
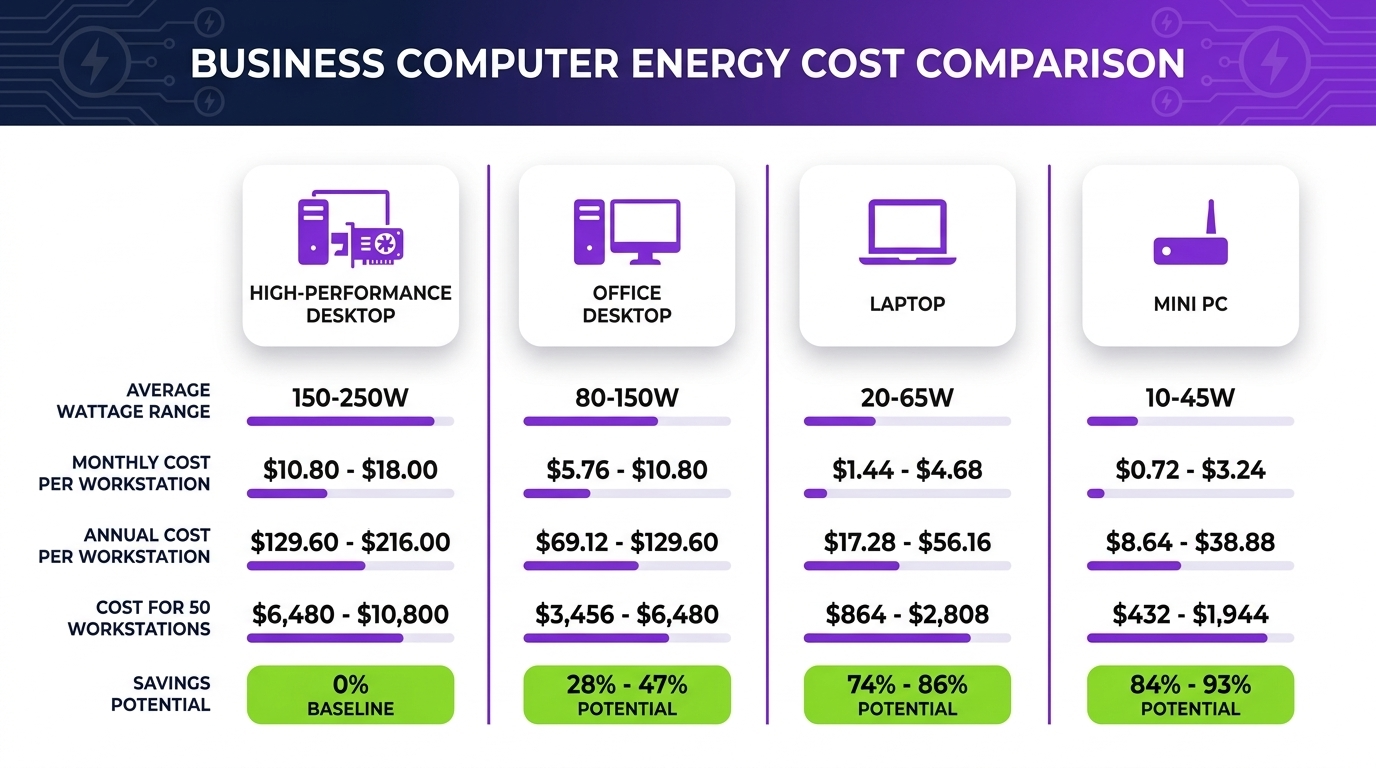
One of the most common errors in fleet energy calculations is applying a single average wattage figure to all devices. Device types vary significantly in consumption, and so do the implications for your calculation.
| Device Type | Typical Active Draw | Typical Idle Draw | Estimated Annual Cost* | Key Variable |
|---|---|---|---|---|
| Budget desktop (integrated graphics) | 55–80 W | 30–50 W | $40–$70 | Overnight behavior |
| Mid-range business desktop | 80–130 W | 45–75 W | $65–$115 | Idle hours |
| High-performance workstation | 200–500 W | 80–150 W | $150–$400+ | GPU load, render time |
| Business laptop (plugged in) | 25–55 W | 10–25 W | $20–$45 | Docking station draw |
| Thin client / VDI endpoint | 8–20 W | 5–12 W | $8–$20 | Server-side compute costs |
| All-in-one desktop | 40–90 W | 25–55 W | $35–$80 | Display size/brightness |
*Estimates based on 8 h active + 4 h idle daily, $0.14/kWh. Actual figures depend on specific hardware and usage patterns.
Why Device Mix Changes Everything
A fleet of 300 devices might include 150 standard desktops, 80 laptops, 50 workstations, and 20 thin clients. Applying a single average wattage produces a calculation that is wrong for every device category. Segmenting by type before running your PC energy cost calculator for business produces far more reliable and actionable numbers.
See Your Real Fleet Energy Numbers
PowerPlug’s platform gives IT and finance teams live visibility into PC energy consumption across every endpoint — so your calculations are based on measured data, not estimates.
Scaling the Calculation to a Full Enterprise Fleet
Individual device calculations are useful for illustrative purposes. What operational decision-makers need is an accurate aggregate view of total fleet energy cost — segmented by device type, location, department, and time window.
A Practical Fleet Calculation Framework
- Step 1 — Inventory segmentation: Categorize all devices by type (desktop, laptop, workstation, thin client). Pull asset inventory data from your CMDB or endpoint management tool.
- Step 2 — Assign wattage profiles: Use manufacturer specifications, measured data, or industry benchmarks for each device category. Create separate active and idle profiles.
- Step 3 — Establish behavioral baselines: Determine how many hours per day each device category is active, idle, in sleep/hibernate, and fully off. This requires endpoint telemetry or agent-based reporting.
- Step 4 — Apply local electricity rates: Use actual tariff data including any demand charges, time-of-use multipliers, and applicable taxes.
- Step 5 — Calculate and aggregate: Run the formula for each segment. Sum to produce a total annual fleet energy cost. Compare against your electricity invoices as a sanity check.
- Step 6 — Model the optimized scenario: Apply target power policy parameters (sleep after N minutes idle, shutdown at end-of-day, wake windows for maintenance) and recalculate. The delta is your savings opportunity.
Fleet Calculation Example — 500 Endpoints
| Segment | Count | Annual Cost (Baseline) | Annual Cost (Optimized) | Saving |
|---|---|---|---|---|
| Mid-range desktops | 300 | $28,500 | $11,400 | $17,100 |
| Business laptops | 120 | $4,560 | $2,280 | $2,280 |
| Workstations | 60 | $15,600 | $7,200 | $8,400 |
| Thin clients | 20 | $260 | $140 | $120 |
| Total fleet | 500 | $48,920 | $21,020 | $27,900 |
Illustrative estimates based on typical power profiles and $0.14/kWh. Your figures will vary based on hardware, location, and usage patterns.
That $27,900 annual saving represents genuine operating expense reduction — cash that can be redeployed toward IT infrastructure, security, or other business priorities. It also represents a measurable sustainability contribution without any change to device functionality or user experience.
Optimization Strategies After You Run the Calculation
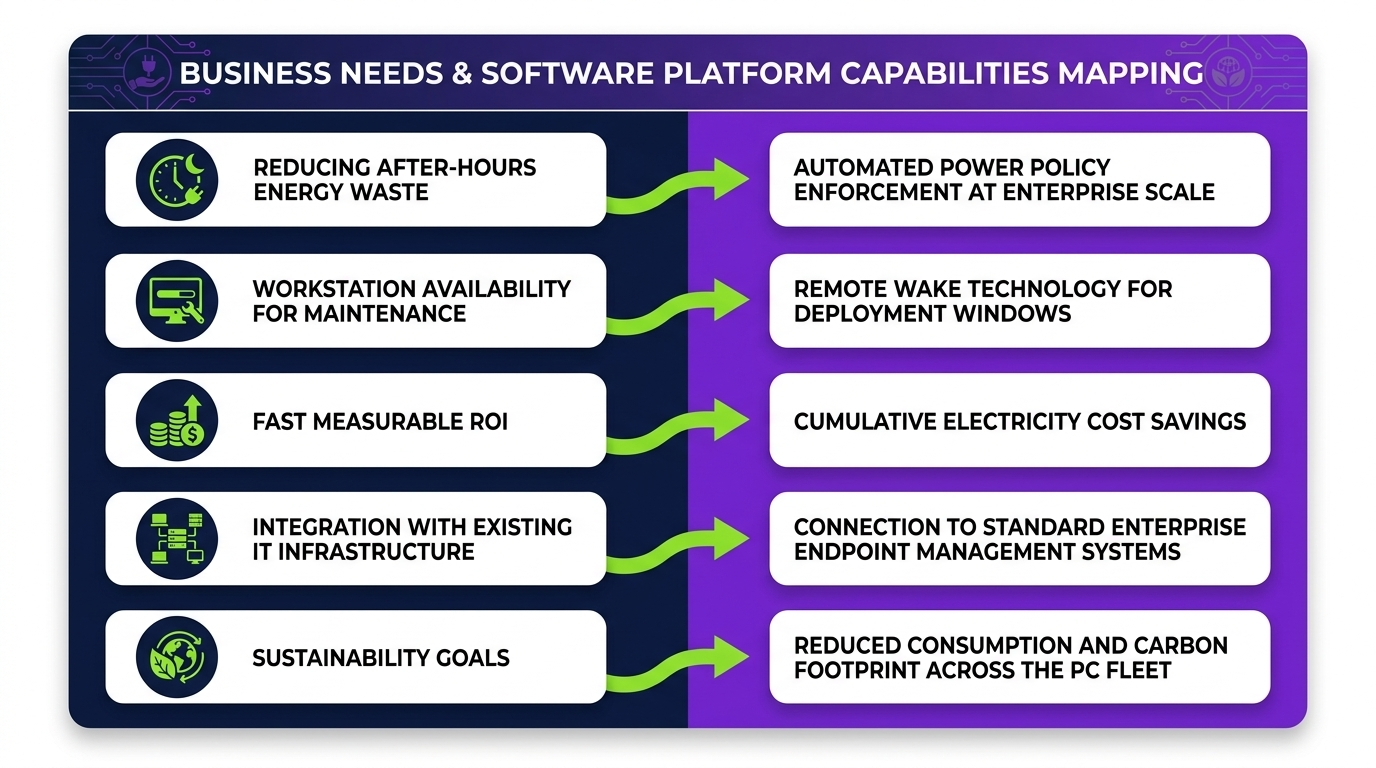
The calculation itself changes nothing. The value is realized through consistent implementation of optimized power policies at scale. These are the levers that move the numbers.
Aggressive Idle Sleep Policies
Setting monitors and hard drives to sleep after 10–15 minutes of inactivity, and the system to sleep after 20–30 minutes, captures the majority of available savings from non-productive idle time. The key challenge in enterprise environments is enforcing these settings consistently across thousands of devices — and ensuring users cannot override them without authorization.
End-of-Day Shutdown Enforcement
Scheduled shutdown at the end of the business day (with an appropriate user warning) eliminates overnight consumption almost entirely. For a 500-device fleet drawing an average of 45 W at idle overnight, eliminating 10 overnight hours per device per day saves approximately 82,125 kWh annually — around $11,500 at $0.14/kWh.
Maintenance Window Optimization
Patch management, backup, and antivirus scans can be scheduled into narrow windows (e.g., 2–4 AM) with devices waking via WoL, completing tasks, and returning to off/hibernate state automatically. This preserves IT workflow while minimizing the energy cost of overnight operations.
Policy Segmentation by Role
Not all users have the same computing patterns. Developers running overnight builds, designers rendering large files, and executives with always-on calendar access have different power requirements than standard office workers. Effective policy segmentation applies appropriate settings to each group rather than forcing a single universal policy that either wastes energy or disrupts operations.
Hardware Refresh Prioritization
Your energy cost data, collected at device level, provides a quantifiable efficiency metric for hardware refresh decisions. Devices with disproportionately high consumption per unit of performance are prime candidates for early replacement, with energy savings contributing to the financial justification.
The Role of PC Power Management Software in Realizing Calculated Savings
Manual policy configuration — pushing settings via Group Policy, SCCM, or individual IT tickets — can produce initial improvements. In practice, policy drift, user overrides, and the complexity of managing thousands of endpoints across departments means that manually configured policies rarely sustain their initial savings over time.
Purpose-built PC power management software addresses these failure modes through:
- Central policy management: Define and enforce sleep, hibernate, and shutdown schedules across the entire fleet from a single console, with role-based segmentation.
- Real-time energy monitoring: Move from estimates to measured consumption data per device, per department, and per location — turning your PC energy cost calculator for business into a live reporting engine.
- Compliance reporting: Track which devices are adhering to policy and which are not, with automated alerts for non-compliant endpoints.
- WoL integration: Schedule wake events for maintenance windows and return devices to low-power states automatically after task completion.
- Carbon and cost dashboards: Translate energy data into cost savings and CO₂ reduction figures for ESG reporting and executive communication.
- User experience protection: Intelligent presence detection and in-use override prevention ensure policies do not interrupt active work sessions.
What to Look for in a Solution
When evaluating power management platforms, the critical differentiators are depth of reporting (can you see device-level data?), policy granularity (can you set different rules for different user groups?), integration with existing endpoint management tools, and the vendor’s track record in enterprise deployments. ROI calculators and pilot programs are standard offerings from credible vendors and provide a low-risk way to validate the business case before full deployment.
Carbon Footprint Quantification and ESG Reporting
The same data that drives your PC energy cost calculator for business also provides the inputs for carbon footprint measurement. This is increasingly relevant for organizations with formal sustainability commitments, investor reporting obligations, or supply chain carbon disclosure requirements.
From kWh to CO₂e
Electricity-related carbon emissions are calculated by multiplying energy consumption (in kWh) by the grid emissions factor for your region (kg CO₂e per kWh). Emissions factors vary significantly by geography and energy mix:
| Region | Approximate Grid Emissions Factor | CO₂e per 500-PC Fleet (Baseline) |
|---|---|---|
| US average | 0.386 kg CO₂e/kWh | ~18.9 tonnes/year |
| UK | 0.207 kg CO₂e/kWh | ~10.1 tonnes/year |
| EU average | 0.233 kg CO₂e/kWh | ~11.4 tonnes/year |
| Australia | 0.650 kg CO₂e/kWh | ~31.8 tonnes/year |
Based on ~48,920 kWh/year fleet baseline. Emissions factors are indicative and change as grid mix evolves.
A 500-device fleet in a typical US office, running without enforced power policies, might be responsible for roughly 19 tonnes of CO₂e per year from PC electricity alone — a figure that an optimized power management strategy can reduce by 55–65% without any change to hardware or user workflow.
Connecting PC Energy Data to ESG Frameworks
Energy savings from PC power management map directly to Scope 2 emissions reductions under the GHG Protocol, making them reportable through CDP, GRI, TCFD, and similar frameworks. The advantage over many other sustainability initiatives is that the underlying data is measurable, verifiable at the device level, and available in real time — qualities that sustainability auditors and investors increasingly demand.
Frequently Asked Questions
What is the most accurate way to measure a PC’s actual power draw?
The most accurate method is direct measurement using a plug-in power meter (such as a Kill A Watt device) placed between the PC and the wall socket. This captures real-world consumption across different operating states. For fleet-wide measurement, endpoint agent software that reads power data from the device’s ACPI/WMI interface provides scalable, automated data collection without requiring physical access to each device.
Does a higher-wattage power supply mean the computer uses more electricity?
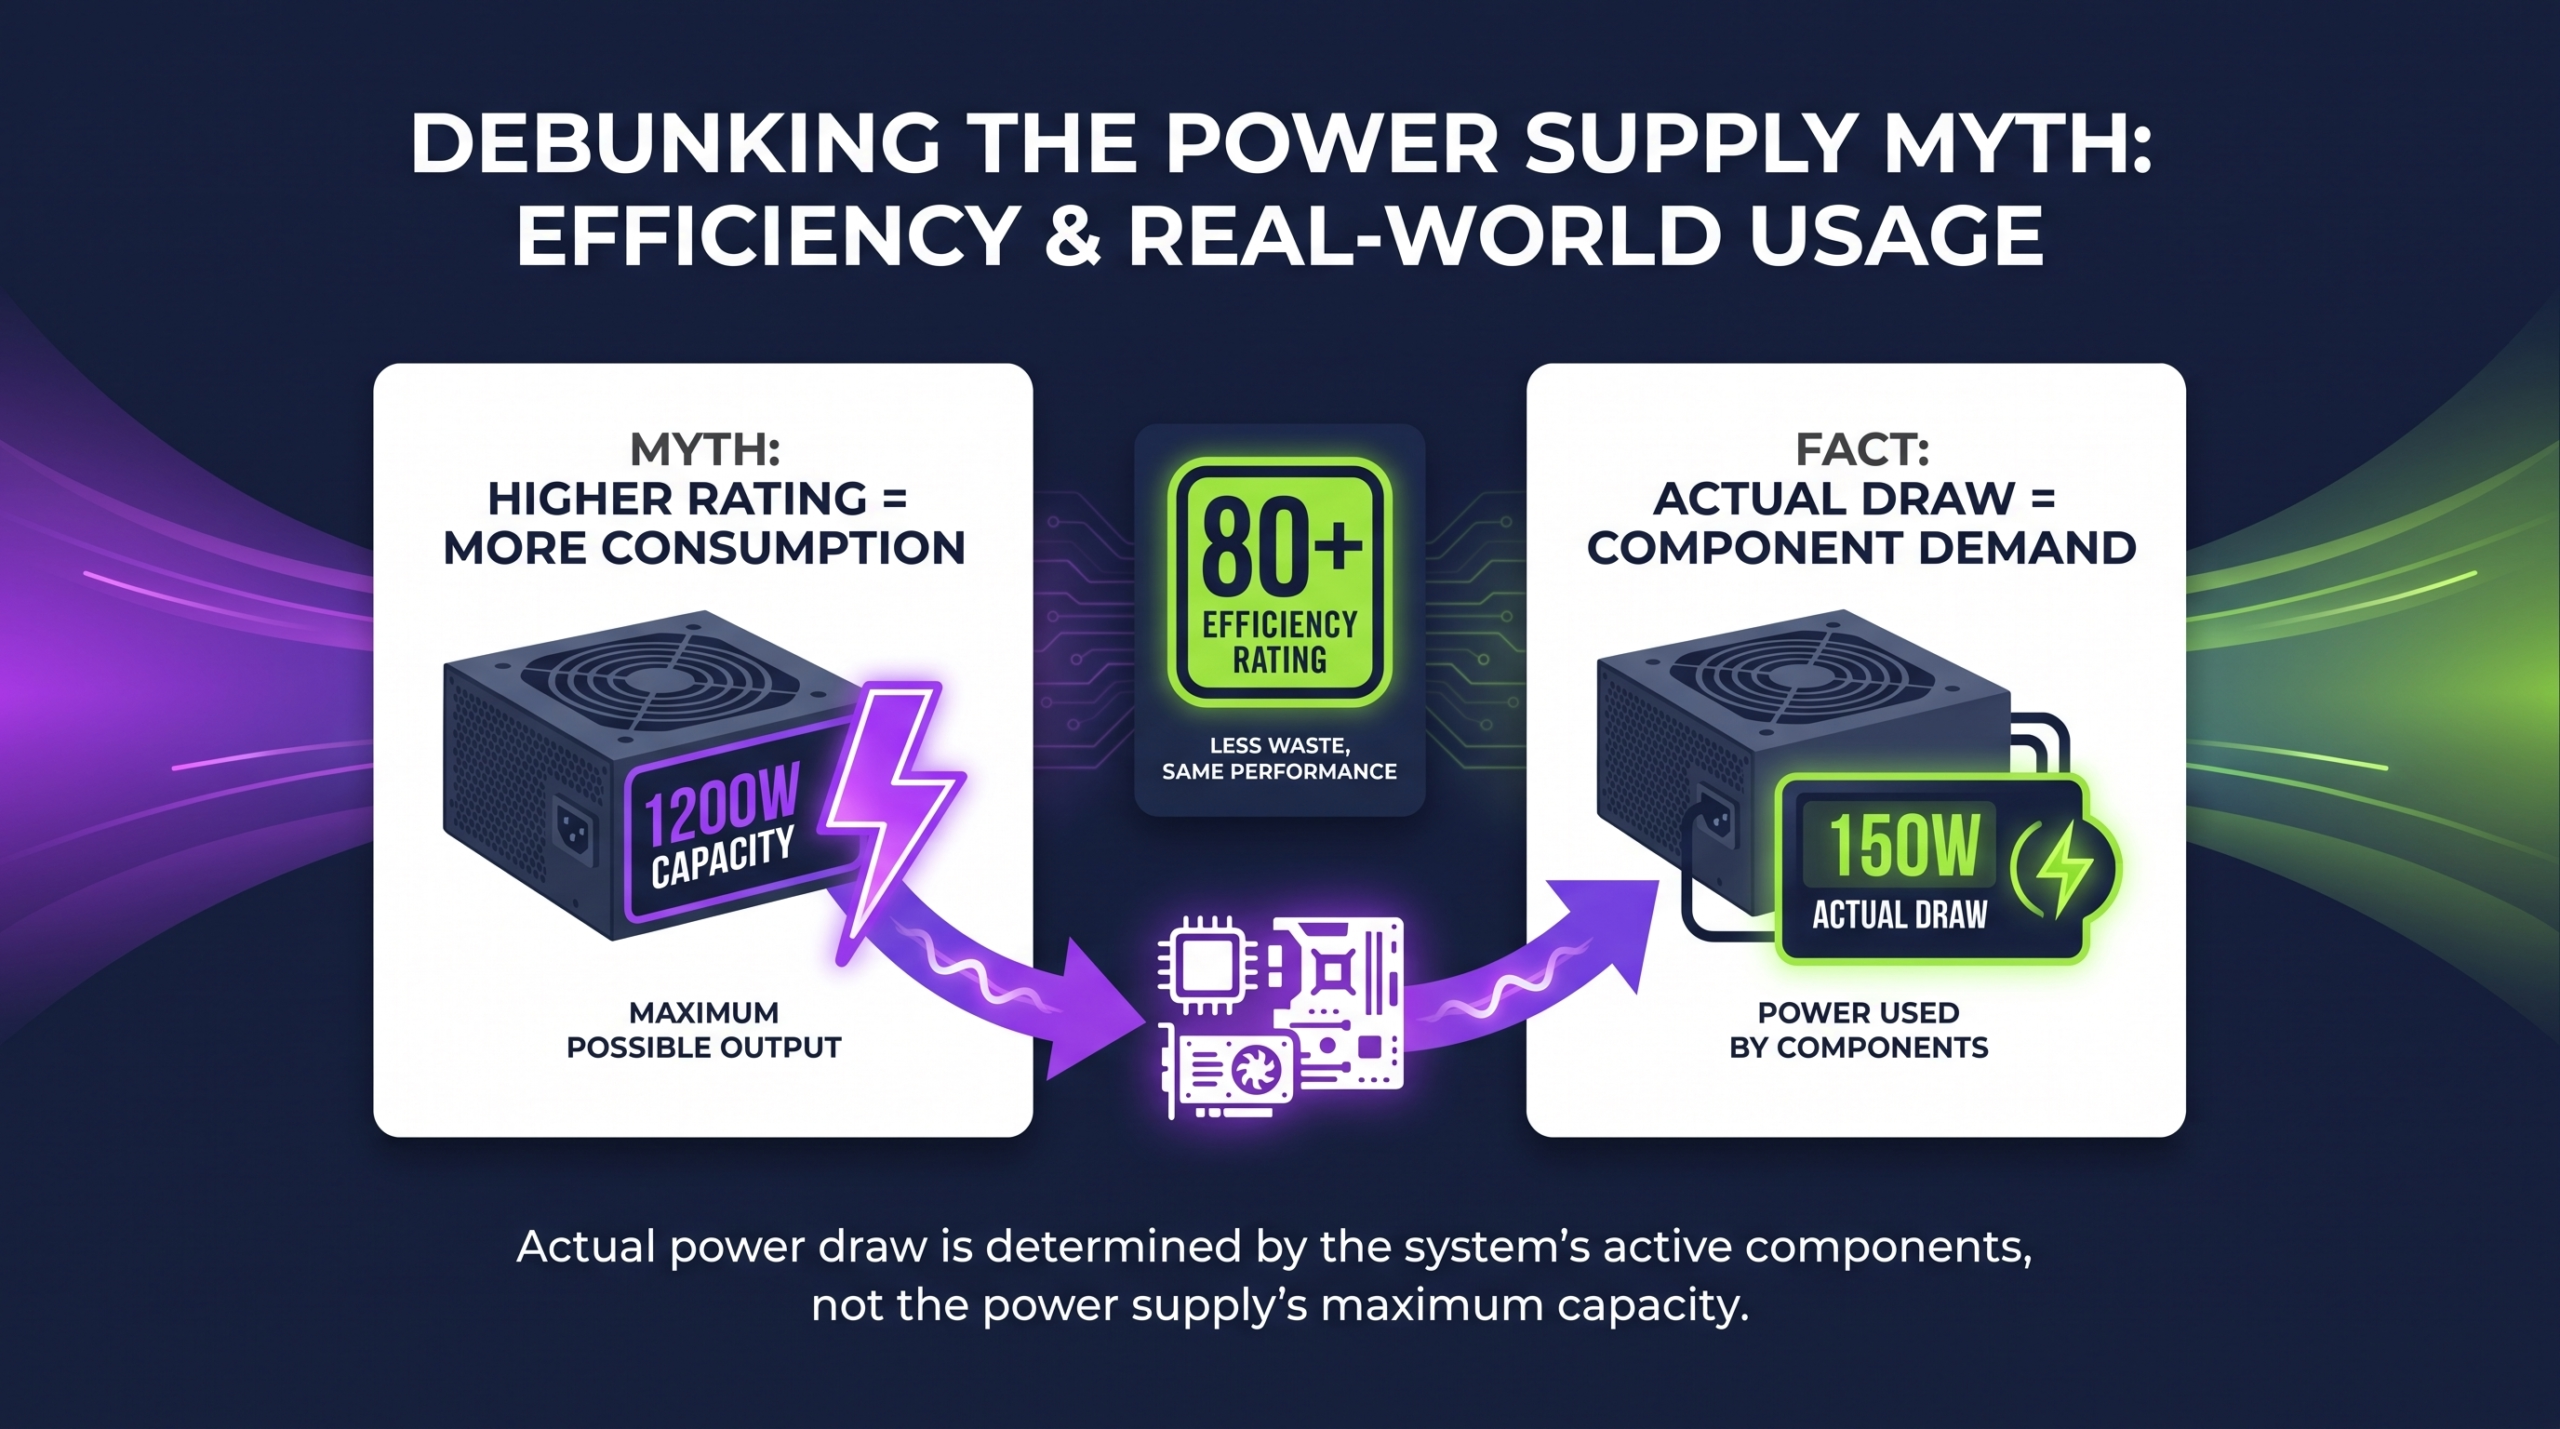
No. The PSU wattage rating represents the maximum capacity the unit can deliver, not what the system actually draws. A PC with a 650 W PSU running a typical office workload might draw only 70–90 W at the wall. Actual consumption is determined by the components in use (CPU, GPU, RAM, storage) and their current load state, not the PSU rating.
How much can an enterprise realistically save with automated PC power management?
Savings vary by fleet composition, existing policies, and electricity rates, but enterprise deployments consistently demonstrate reductions of 40–70% in PC-related energy costs. The largest gains come from eliminating overnight and weekend idle consumption — periods that typically represent 30–50% of a device’s annual energy draw but produce zero productive output.
Will enforcing sleep policies disrupt users or IT operations?
Properly designed power management solutions use intelligent presence detection to avoid interrupting active sessions. Maintenance windows (patching, backups) are handled through scheduled WoL events that wake devices within defined time windows and return them to low-power states automatically. The user experience impact is negligible when policies are configured correctly — the primary concern for most IT teams is the initial configuration and change management process, not ongoing disruption.
How do I find the right electricity rate to use in my calculation?
Use the total cost per kWh from your most recent electricity invoice, including all taxes, distribution charges, and applicable fees. If your organization is on a time-of-use tariff, use a weighted average across peak and off-peak periods, or apply different rates to peak-hours and off-peak-hours components of your calculation separately. For multi-site organizations, calculate separately for each location if tariffs differ materially.
Can PC energy cost savings be used to justify hardware refresh investment?
Yes. Device-level energy consumption data provides a quantifiable efficiency metric that can be incorporated into hardware refresh ROI models. A device drawing 50% more power per unit of performance than its modern equivalent is generating measurable excess cost year over year. That cost, calculated over a 3–5 year ownership horizon, contributes directly to the financial justification for early replacement.
What is a realistic payback period for PC power management software?
For fleets of 200 or more endpoints, ROI periods of 3–6 months are commonly reported. The payback period depends on three variables: fleet size (more devices means faster ROI), current baseline consumption (higher waste means more savings available), and electricity rates (higher rates accelerate payback). Vendors offering pilot programs can provide projected ROI figures based on your actual fleet data before you commit to full deployment.
Transform Your PC Energy Calculation Into Real Savings
PowerPlug’s enterprise PC power management platform takes you from calculation to continuous, automated optimization — delivering measurable cost reduction, compliance reporting, and sustainability data from day one.