
Power Management Reporting for C-Suite Executives – A Board-Ready Framework
By Nimrod Yedaya, VP Customer Experience

Enterprise leadership teams need more than sleep timers, endpoint logs, or IT configuration data. They need measurable proof that PC power policies reduce energy consumption, operating costs, and carbon emissions. Achieving that level of clarity requires a structured approach to power management reporting C-suite executives can rely on for capital planning and governance. This guide outlines what to report, which metrics matter to finance versus IT operations, how to prove verified reductions, and how to structure a board-ready energy savings report. PowerPlug Pro provides the endpoint power management platform engineered to turn distributed desktop telemetry into verified, executive-ready intelligence.
Reading time: 13 minutes
What is power management reporting for C-suite executives?
Power management reporting for C-suite executives is a concise, decision-ready view of how endpoint power policies translate into measurable kilowatt-hour reductions, lower operating expenditures, and verified greenhouse gas abatement across an organization. It bridges the gap between low-level endpoint configurations and high-level corporate performance indicators.
This is business outcome reporting tied directly to financial impact and accountability, not operational IT telemetry. Corporate leadership teams look for four fundamental pillars: return on investment, operational risk mitigation, policy governance, and multi-period trendlines. While desktop engineers track registry settings and group policy distribution, executives need PC power management reporting that shows portfolio-level performance. A typical monthly executive energy report aggregates total kilowatt-hours saved against projected targets, highlights exception rates across business units, and details planned adjustments to maximize verified energy savings reporting across the entire device fleet.
Why do executives want a power savings report instead of raw IT power policy data?
Executives require accountability, verified cost avoidance, and clear operational risk profiles rather than raw configuration parameters like display timeouts, sleep thresholds, or device power states. Raw configuration records tell leadership what IT intended to configure, not what actually happened on the office floor.
A defensible reporting architecture operates through a three-step progression. Defined power policies establish rules. Monitored endpoint agents verify behavioral change. Documented kilowatt-hour reductions deliver verified savings. Raw technical telemetry invites endless debate over device availability, user disruption, and measurement accuracy. Outcome reporting cuts through operational noise to support concrete capital decisions, such as expanding policy coverage, funding infrastructure upgrades, or refining sustainability targets. The underlying telemetry remains vital for systems administration, but energy efficiency program governance requires that finance receives energy cost avoidance reporting, IT leadership receives endpoint policy compliance reporting, and sustainability teams receive auditable carbon metrics, all derived from a single reconciled data model covering sleep, hibernate, and shutdown policy reporting.
What should an executive energy dashboard include to be “board-ready”?
A board-ready executive energy dashboard combines a small set of primary metrics with explicit accounting definitions, a defensible baseline methodology, and a short narrative that explains operational variance across the endpoint estate. It eliminates guesswork by linking headline figures to an underlying power state audit trail.
Board-ready KPI set
The top row of an executive energy dashboard presents core performance metrics: net energy saved in kilowatt-hours, gross cost avoided in currency, Scope 2 emissions avoided, fleet management coverage percentage, policy compliance percentage, and variance against the prior reporting period. A secondary drivers panel highlights the primary business units contributing to reductions, lingering insomnia endpoints that fail to enter low-power states, and deployment progress across newly provisioned hardware. This structured presentation provides a complete executive KPI pack for energy savings that aligns financial performance with operational reality.
| Metric Shown | Definition | Data Source | Owner | How to Validate |
|---|---|---|---|---|
| Cost avoided | Monetary reduction from avoided kilowatt-hour draw | Utility tariff model applied to endpoint telemetry | Finance | Reconcile rate assumptions against electric utility bills |
| Kilowatt-hours saved | Net electrical energy saved versus verified baseline | Calculated endpoint operational runtimes and power states | IT Operations | Compare active and low-power runtimes against baseline |
| CO2e avoided | Metric tons of greenhouse gases prevented | EPA eGRID or regional emission factors | Sustainability | Multiply saved kilowatt-hours by published grid factors |
| Fleet coverage | Percentage of active endpoints running policy agent | Active Directory computer records versus agent inventory | IT Operations | Audit unmanaged systems against domain directory inventory |
| Policy compliance | Target machines executing scheduled low-power transitions | Endpoint power state logs and event counters | IT Operations | Verify sleep and shutdown transitions in event logs |
| Potential vs actual | Theoretical savings versus realized and verified savings | Policy modeling engine versus recorded runtime data | Finance | Evaluate gap caused by exceptions and off-network systems |
| Wake success rate | Percentage of endpoints answering wake commands | Wake-on-LAN and portal connection logs | IT Operations | Compare initiated maintenance packets to target responses |
| Exception rate | Authorized devices excluded from automatic shutdown policies | Central exception database and exemption tickets | IT Operations | Review business justification tickets on scheduled cycles |
Executive narrative layer
Every board-ready energy savings report requires a concise explanatory narrative accompanying the numbers. A sudden drop in kilowatt-hour savings dashboard performance might stem from an extended patch deployment window, a shift in corporate telework patterns, or an unmanaged software update that prevents endpoints from entering sleep mode. Explaining what changed, why the variance occurred, and which corrective measures IT implemented preserves executive confidence and prevents misinterpretations during board reviews.
Audit trail expectations
Defensible reporting requires documented governance standards. Every metric displayed must link to a written definition, an explicit reporting period, a defined hardware scope, and a designated departmental owner. The system must retain historical power state records for every device, allowing internal auditors to trace aggregate financial claims back to verified machine-level behavior. PowerPlug Pro brings these operational metrics, policy controls, and audit trails together in one place, which you can see on Our Platform.
What KPIs do CFOs care about in power management reporting?
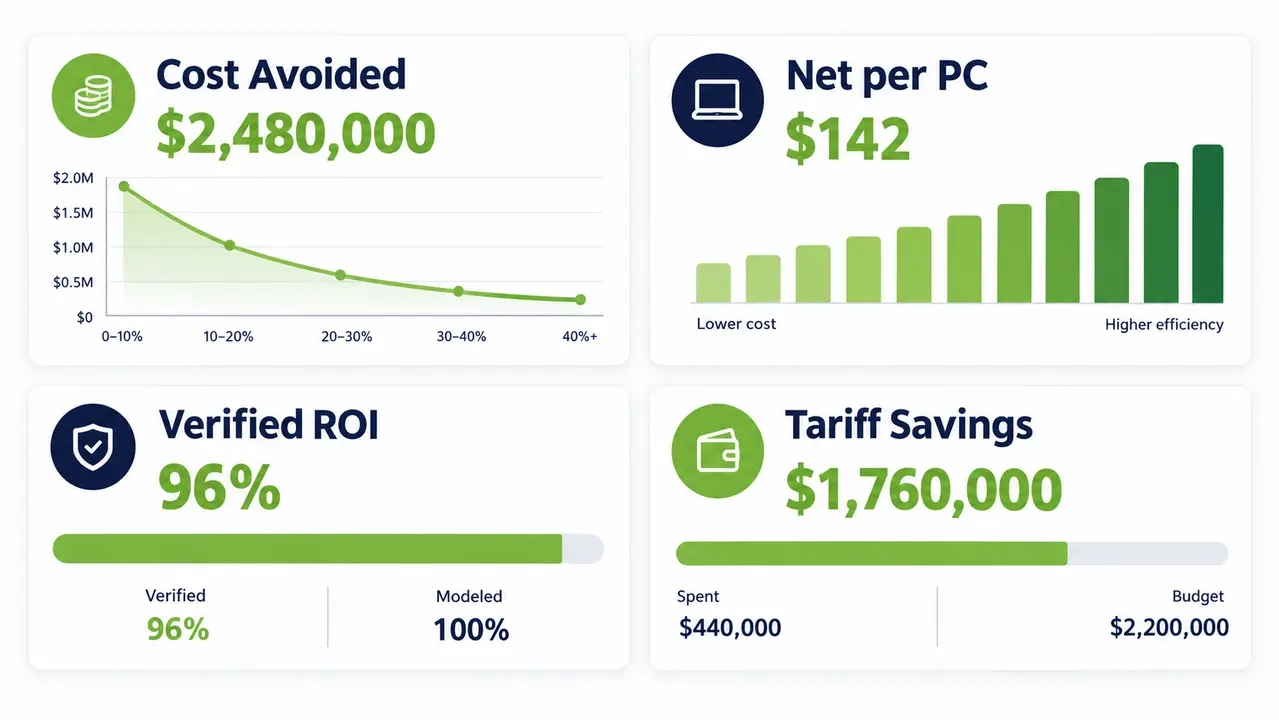
Chief Financial Officers evaluate power management through the lenses of operating expense reduction, payback velocity, forecast accuracy, and auditable savings attribution. They need reassurance that published savings stem from active policy enforcement rather than seasonal workplace shifts or reductions in headcount.
Cost avoidance by tariff band. Finance teams need energy cost avoidance reporting broken down by specific utility rates and calendar months. In facilities with variable electricity structures, time-of-use tariff savings analysis proves that policies power down endpoints during expensive peak pricing hours or late-night shoulder periods, producing outsized financial returns.
Net savings per endpoint. Evaluating savings on a per-device basis allows finance leaders to benchmark department efficiency and forecast savings as the organization expands or consolidates hardware assets.
Verified versus modeled savings indicators. Every number presented to finance must carry a clear methodology label. Modeled estimates rely on lab assumptions; verified energy savings reporting relies on empirical power state changes recorded across active endpoints.
Distinction between cost avoidance and budget cuts. Cost avoidance measures utility expenses prevented through conservation, shielding operating margins from rising electric utility rates even when headline utility bills fluctuate due to weather or expansion. Finance teams require published tariff rates and billing period alignments alongside every savings figure to maintain audit integrity.
What KPIs do CIOs and IT operations leaders care about?
Information officers and infrastructure directors focus on endpoint health, policy compliance, operational availability, and security patch reliability. Their core priority is verifying that energy reduction initiatives never degrade administrative control or disrupt employee productivity.
Endpoint coverage and inventory visibility. IT leadership monitors the proportion of the device fleet running active management agents, alongside tracking unreachable, offline, or obsolete machines that slip outside governance boundaries.
Wake success rates for maintenance. Patching compliance requires reliable wake scheduling for patching. Operational leaders review the percentage of sleeping or shut-down machines that successfully wake across subnets during scheduled wake-on-LAN maintenance windows to receive critical operating system and application updates.
Exception rates and local policy drift. Central dashboards must identify endpoints where local users or third-party software have overridden central power configurations, allowing administrators to correct configuration drift before energy waste compounds.
Helpdesk impact indicators. Tracking support tickets related to system sleep or remote connectivity ensures that endpoint policy compliance reporting reflects efficient operation rather than end-user friction. Reconciling the CIO operational view and the CFO financial view to identical endpoint telemetry eliminates organizational conflict and validates program success.
What is an “executive energy dashboard” in endpoint power management (and how is it different from building energy dashboards)?
An endpoint executive energy dashboard monitors and optimizes the operational power states of distributed IT assets, whereas building energy dashboards track facility infrastructure including heating, ventilation, air conditioning, and architectural lighting. Both tools support corporate sustainability, but their underlying control levers and operational owners remain entirely separate.
Facility systems operate according to broad environmental schedules managed by building engineers. Endpoint energy management analytics focuses on intelligent, distributed devices that move between active use, idle time, low-power sleep, hibernation, and soft-off states based on employee workflows. As defined in the ENERGY STAR program requirements for computers, modern PCs incorporate standardized power states designed to drastically reduce power draw when idle. Idle time optimization reporting gives IT leaders precise control over these digital assets, enabling dynamic policies that adapt to individual user behavior while maintaining endpoint availability for administration. While facilities management manages fixed real estate assets, IT operations manages the computing fleet, feeding distinct operational reductions into the overarching corporate energy report.
What is “management energy analytics” for endpoint fleets?
Management energy analytics transforms raw device telemetry, user activity counters, and electrical runtime records into actionable insights that leadership uses to eliminate operational waste, refine policies, and optimize capital refresh cycles. It replaces static snapshots with dynamic intelligence regarding fleet utilization patterns.
Enterprise analytics identifies localized clusters of waste, such as engineering workstations left running intensive graphics processes overnight or call center departments where compliance drops following shift changes. By analyzing after-hours power consumption across distinct hardware tiers, organizations establish targeted policies that address device fleet energy analytics without imposing blanket rules that hinder specialized business groups. This targeted approach accelerates endpoint energy waste reduction while keeping departmental managers fully engaged in the governance process.
A standard Pareto chart illustrates the top drivers of endpoint waste, revealing that eighty percent of unnecessary power consumption typically stems from a small number of operational issues: unmanaged after-hours runtime, software-induced insomnia states, unreviewed departmental exception groups, and local power plan overrides.
Analytics views executives actually use
Executives rely on portfolio rollups that summarize cost avoidance by business unit, historical benchmarking that tracks progress against annual efficiency mandates, and exception summaries that highlight operational areas requiring managerial intervention.
Operational views that support the executive story
IT engineering teams support executive headlines with granular root-cause analysis, diagnosing specific network cards blocking low-power transitions, background software services preventing system sleep, and subnet configurations inhibiting automated wake commands.
What’s the difference between potential savings and actual savings?
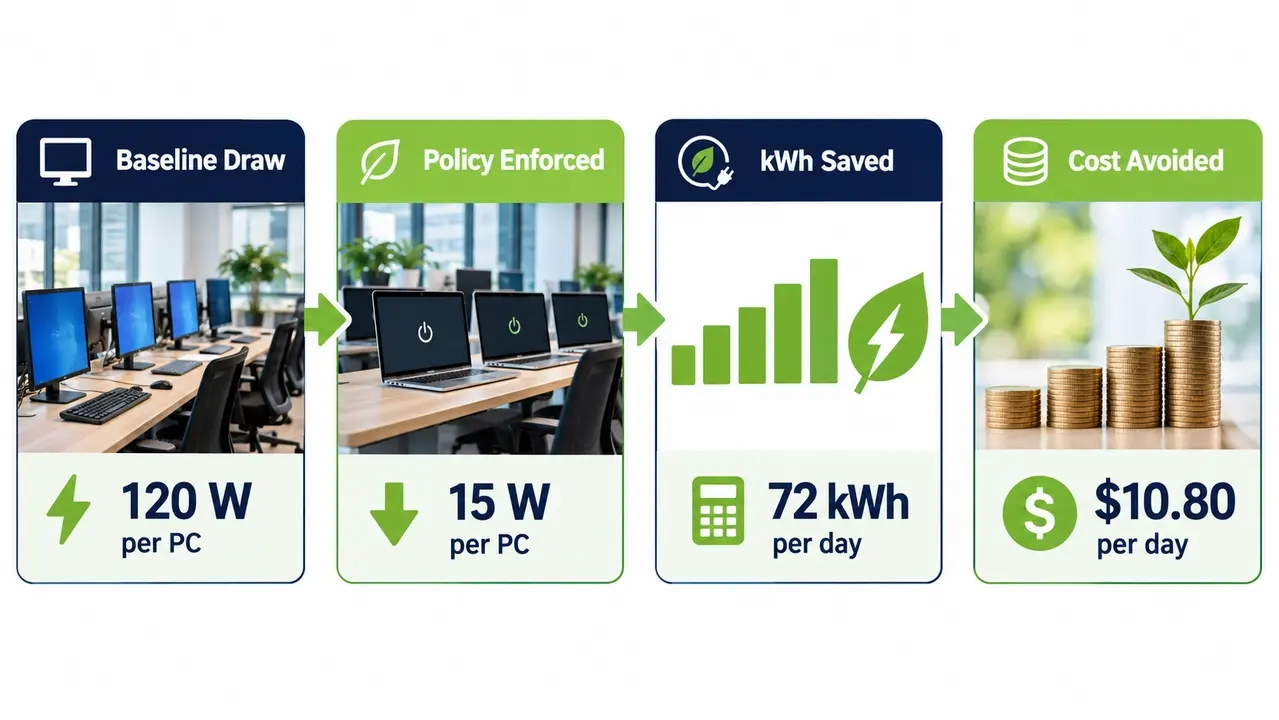
Potential savings represents the theoretical financial and electrical reduction achievable if every endpoint in the enterprise adheres perfectly to an aggressive power management schedule. Actual savings measures the verified reductions achieved after factoring in real-world user activity, business exceptions, and operational maintenance windows.
Both metrics serve vital governance roles. Potential savings justifies the initial business case, demonstrating the total financial opportunity available to leadership. Actual savings governs ongoing operations, proving the realized return on investment and validating program efficacy. If an enterprise deploys an aggressive power policy across only sixty percent of its endpoints, the potential savings will remain high while actual savings reflect only the managed cohort. Transparently reporting both figures prevents inflated projections and maintains executive trust. As outlined in federal guidelines for energy savings performance contracts, verified energy savings reporting requires continuous measurement and verification rather than relying on unadjusted initial estimates.
How do you calculate cost savings from PC power management?
Cost savings are calculated by converting verified reductions in electrical consumption, measured in kilowatt-hours, into currency by applying the organization’s relevant utility tariffs, ensuring that documented savings reflect policy-driven changes rather than unrelated business disruptions.
The calculation tracks the reduction in operational hours across fleet power states. By comparing the duration endpoints spend in active and idle states against historical pre-policy baselines, the reporting system calculates total avoided kilowatt-hours. Multiplying those avoided kilowatt-hours by applicable utility rates yields verified financial savings. Finance leaders will routinely examine rate structures, billing period alignments, and operational assumptions, making mathematical transparency essential for every published report.
Rate handling and utility structure impact
Applying a flat, blended electricity rate offers simplicity for high-level executive summaries. In organizations operating under dynamic tariff structures, time-of-use tariff savings analysis delivers greater accuracy by assigning higher monetary value to energy reductions achieved during expensive peak billing windows, demonstrating superior financial performance.
Attribution logic for policy-driven savings
Accurate attribution logic isolates kilowatt-hours saved through automated policy enforcement from incidental reductions caused by employee holidays, facility closures, or voluntary manual shutdowns. Excluding temporary operational exceptions and external anomalies prevents overstated energy cost avoidance reporting and maintains audit credibility.
Find out what your fleet could save
PowerPlug Pro calculates verified kilowatt-hour and cost savings from actual endpoint power states, using your utility tariffs and a documented baseline.
How do you prove energy savings are real (and not just optimistic estimates)?
Proving energy savings are real requires establishing empirical operational baselines before policy activation, recording continuous device-level telemetry, applying transparent tariff schedules, and reconciling recorded power states against verified fleet inventory. Defensible numbers withstand external financial scrutiny and rigorous technical review.
The enterprise trust stack rests on five core principles: a strictly defined endpoint scope, a verified pre-policy baseline measurement period, standardized regional emissions factors, validated electric utility rates, and systematic accounting for operational exceptions. Measurement and verification practice, such as the IPMVP generally accepted principles, stresses consistent baselines and transparent assumptions. Internal auditors accept verified reports when supported by detailed endpoint audit logs, fleet coverage inventories, and documented calculation methodologies that remain consistent across reporting quarters. PowerPlug Pro maintains a comprehensive power state audit trail for every endpoint, giving organizations verified energy savings reporting that satisfies both internal controllers and third-party sustainability auditors.
A standard energy waterfall chart illustrates the verification pathway, starting with baseline fleet energy consumption, subtracting verified reductions achieved through policy enforcement, adding back energy consumed during authorized maintenance exceptions, and arriving at net verified energy savings.
How do you roll up power management reporting across thousands of endpoints?
Rolling up power management reporting across tens of thousands of endpoints requires a structured operational hierarchy based on geographic site, operating entity, and departmental cost center, using normalized performance indicators to provide meaningful comparisons across disparate operating environments.
A multinational financial institution or regional healthcare provider cannot accurately evaluate branch offices against corporate headquarters without normalizing data on a per-device or per-workday basis. Segmenting device fleet energy analytics by hardware class (such as standard desktop towers, high-performance engineering workstations, and mobile laptops) ensures policies reflect actual equipment power requirements. A consolidated monthly summary presents portfolio rollup reporting across sites and business units, allowing executive leadership to identify top-performing operating units and target underperforming divisions for corrective action.
A fleet coverage stacked bar chart provides an immediate visual summary of management reach, segmenting total enterprise systems into fully managed endpoints, unmanaged devices requiring agent deployment, and offline systems requiring connectivity remediation.
A benchmark scatter plot maps savings per endpoint against policy compliance percentages across corporate operating entities, pinpointing high-performing business units in the upper quadrant and flagging lagging sites that require administrative review. For an example of large-scale rollout in a multi-site healthcare environment, see the Clalit Health Services case study.
How often should we send a power savings report to executives and the board?
Organizations maintain effective oversight by delivering a monthly executive energy report to operating leadership, presenting a consolidated summary to the board of directors quarterly, and providing technical operational dashboards to systems administrators on a weekly schedule.
Weekly operational reviews for IT teams. Technical teams monitor wake success rates, agent connectivity, patch completion status, and local policy overrides weekly to address technical anomalies before they impact monthly metrics.
Monthly executive reviews for operating leadership. Chief Information Officers and financial controllers review monthly performance reports to track cost avoidance against budget, evaluate departmental compliance variance, and approve minor policy adjustments.
Quarterly governance reviews for the board of directors. Executive leadership presents high-level quarterly summaries to the board of directors and sustainability committees, incorporating verified energy savings, financial returns, and greenhouse gas metrics into broader ESG governance frameworks. This tiered cadence ensures appropriate visibility without overwhelming leadership with operational details.
Frequently asked questions
Does power management reporting support ESG, carbon accounting, and sustainability disclosures?
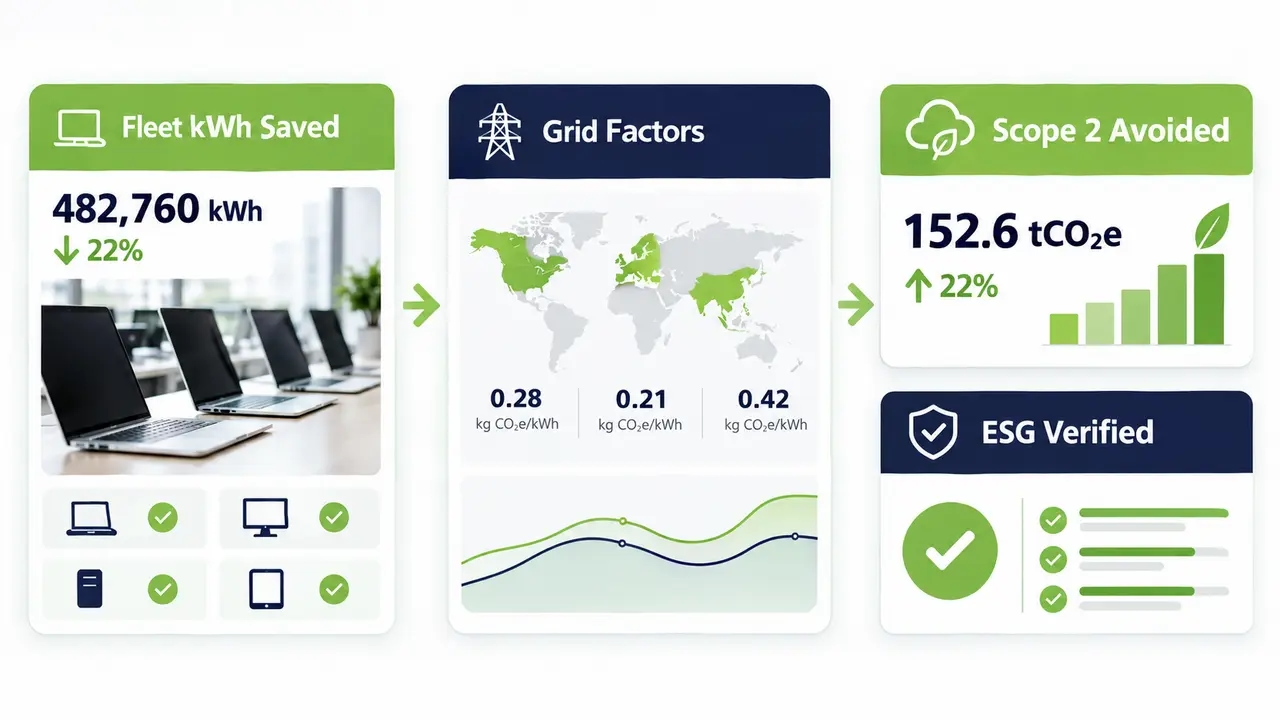
Power management reporting directly supports corporate ESG reporting, greenhouse gas accounting, and regulatory sustainability disclosures by providing auditable records of electricity reductions that feed directly into Scope 2 emissions inventories.
Under the Greenhouse Gas Protocol Scope 2 Guidance, indirect emissions stemming from purchased electricity represent a primary target for corporate decarbonization. Because electricity grid emissions intensity varies by geographic region, reporting frameworks must apply accurate, location-based emission factors, such as EPA eGRID factors in the United States or published international equivalents. Clear methodology documentation and period alignment allow sustainability teams to translate verified kilowatt-hour reductions into defensible CO2e savings reports without risk of double-counting. Reporting should separate genuine operational energy demand reductions from market-based instruments like renewable energy certificates. While a PC power savings report does not replace a comprehensive corporate emissions filing, it delivers audit-ready sustainability reporting for IT operations that substantiates green computing claims.
How do you enforce power savings without disrupting employees or IT maintenance?
Disruption is avoided by deploying activity-aware endpoint software that verifies genuine user idle states before initiating power-down routines, combined with automated wake scheduling that ensures endpoints remain fully accessible for enterprise maintenance windows.
Executive hesitation around power management usually stems from two operational fears: interrupting active employee workflows and causing missed security updates. Modern endpoint management overcomes these challenges through intelligent idle detection that monitors active user input, CPU utilization, running background applications, audio output, and active presentation sessions. If a system is performing vital business tasks, the policy delays action. For administrative maintenance, centralized management coordinates with systems like Microsoft Configuration Manager, using wake-on-LAN maintenance windows to wake sleeping systems, execute patch deployments, verify installation, and return systems to low-power states. PowerPlug Pro uses Wake-Up Technology to bring devices back for scheduled updates, then return them to a low-power state, safeguarding network security while maximizing financial savings.
What should a C-suite “power savings report board” slide look like?
A board-level slide must deliver an uncluttered, single-page summary highlighting verified financial returns, operational fleet health, sustainability progress, and clear executive decisions required to sustain program momentum.
An effective board presentation follows an intuitive layout designed for rapid executive review:
Primary metric banner. The top strip highlights four essential metrics: total net dollars avoided, kilowatt-hours conserved, metric tons of CO2e avoided, and overall fleet policy compliance.
Multi-period financial trendline. Chart A illustrates month-over-month performance through a dual-axis trend line displaying verified kilowatt-hours saved alongside cumulative financial cost avoidance, annotated with major rollout milestones and policy updates.
Fleet governance and risk indicators. A compact status panel displays total managed endpoint coverage, wake reliability for maintenance windows, and the current volume of authorized operational exceptions.
Action and governance decisions. The closing section outlines specific managerial decisions required, such as expanding policy coverage to newly acquired facilities, authorizing updated power thresholds, or retiring legacy hardware clusters.
Build a board-ready reporting framework
Review your endpoint fleet potential with our team and set up reporting that your finance, IT, and sustainability leaders can all stand behind.
Defensible power management reporting C-suite executives trust is simple, mathematically transparent, and verified through empirical telemetry. Contact the PowerPlug Pro team to review your endpoint fleet potential and establish a board-ready reporting framework for your organization.

About the author
Nimrod Yedaya
VP Customer Experience
Over 15 years of experience in customer service, technical support, and customer relationships. Nimrod joined PowerPlug in 2012 as Customer Support Manager and was promoted to VP in 2016. He holds an MBA from BIU and a BSc in Communication Systems Engineering from BGU.