
Enterprise PC Energy Benchmarking Guide
By Nimrod Yedaya, VP Customer Experience
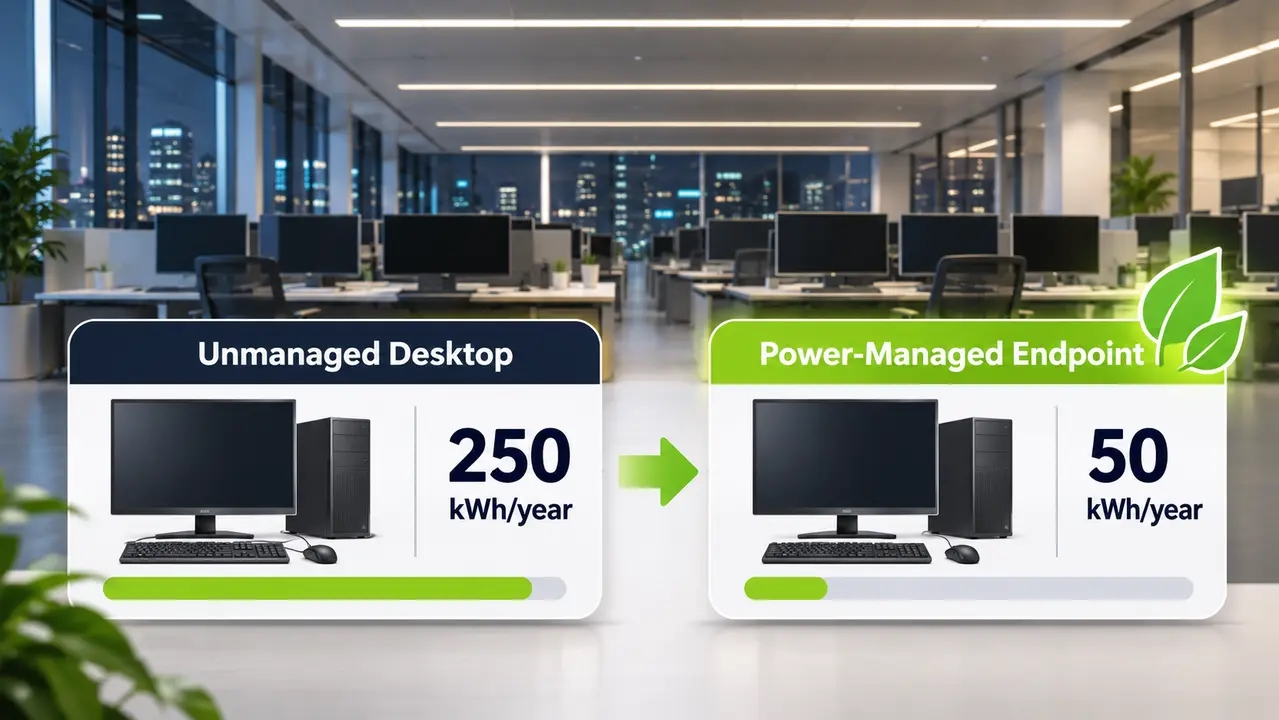
Walk into an empty corporate office tower in Dallas at two in the morning. Thousands of monitors emit a pale glow while desktop towers hum quietly under vacant cubicles. Facilities teams turned off the air conditioning and dimmed the hallway lighting hours ago. End-user computing hardware continues drawing full utility power without performing useful work.
IT managers routinely treat endpoint electricity as an untracked overhead expense absorbed by real estate budgets. Facilities directors view endpoint wattage as an unpredictable plug load beyond their operational mandate. This organizational division blinds enterprises to their largest controllable source of digital electricity waste.
Resolving this operational divide requires treating endpoint power as an engineering discipline governed by continuous measurement. This guide establishes empirical benchmarks and telemetry models to eliminate wasted kilowatt-hours across distributed endpoint estates without compromising patch cycles or user productivity.
Unmanaged endpoints quietly bleed capital.
Reading time: 5 minutes
Defining Enterprise PC Energy Benchmarking Beyond Nameplate Ratings
Carrying out benchmarking enterprise PC energy consumption requires establishing a verified baseline of electricity consumption in kilowatt-hours across an organization’s computing estate over a set timeframe. That equipment inventory includes desktop towers and mobile laptops alongside specialized technical workstations and external displays. The measurement timeline must track consumption across monthly, quarterly, and annual operational cycles.
Consumer testing measures individual devices under clean laboratory conditions. In contrast, enterprise benchmarking evaluates aggregate fleet behavior across thousands of machines running corporate software stacks. Enterprise metrics account for real user duty cycles alongside background applications and after-hours power states during maintenance windows.
Organizations undertake this benchmarking process to serve three core operational drivers. First, it identifies energy waste to drive operating expenditure reductions across distributed corporate facilities. Second, it generates defensible Scope 2 greenhouse gas reporting data required for regulatory frameworks like the Corporate Sustainability Reporting Directive. Third, it validates whether power policies deployed through configuration tools actually execute on physical endpoints.
Realistic Annual kWh Benchmarks Across Endpoint Hardware Profiles
Hardware manufacturers publish Typical Energy Consumption ratings derived from standardized operational cycles. These ratings assume a computer spends roughly forty-five percent of its operational life in sleep mode. Enterprise reality consistently contradicts that assumption.
Field measurements by the Lawrence Berkeley National Laboratory show commercial desktops spend immense amounts of time active or idling overnight when centralized power policies are missing. Researchers documented these usage patterns in their field study of computer use and national energy consumption. Unmanaged corporate environments regularly see forty to sixty percent of desktop fleets left running around the clock.
A well-managed enterprise desktop with automated sleep enforcement consumes between 40 and 90 kWh per year. That same machine running unmanaged twenty-four hours a day consumes 180 to 350 kWh annually. Specialized engineering workstations running graphics software or financial models draw between 400 and 800 kWh per year when left continuously active. Corporate laptops draw between 20 and 50 kWh annually because their mobile architecture prioritizes power conservation. External 24-inch monitors draw 25 to 50 kWh in normal managed use, but jump past 80 kWh when display sleep fails.
Laboratory ratings measure theoretical efficiency while enterprise operations dictate actual consumption.
| Endpoint Profile | Management Policy | Active / Idle Draw | Annual Energy | Annual Cost ($0.15/kWh) |
|---|---|---|---|---|
| Well-Managed Desktop | 15-Minute Sleep & Weekend Shutdown | 35W to 55W | 45 to 85 kWh | $6.75 to $12.75 |
| Unmanaged Desktop | Always-On 24/7/365 | 35W to 60W | 220 to 350 kWh | $33.00 to $52.50 |
| Technical Workstation | Unmanaged Continuous Operation | 90W to 220W | 788 to 1,927 kWh | $118.26 to $289.08 |
| Enterprise Laptop | Managed Modern Standby | 15W to 30W | 25 to 45 kWh | $3.75 to $6.75 |
| Dual 27-inch Displays | Active for 8 hours per workday, 260 days annually; standby outside working hours | 40W to 60W combined while active | At least 83 to 125 kWh from active use, plus standby consumption | At least $12.48 to $18.72, plus standby electricity costs |
Fleet Energy Calculations and ACPI Power State Modeling
Calculating enterprise fleet power consumption requires selecting between simple mathematical estimation and dynamic telemetry modeling. Simple models offer quick estimates for high-level budgeting, whereas telemetry provides the rigorous data necessary for sustainability audits.
Simplified Fleet Estimation Formula
Organizations without endpoint monitoring agents rely on top-down calculations. The basic formula multiplies total device count by operational hours and average wattage across active, idle, and sleep states. That watt-hour total is then divided by one thousand to produce kilowatt-hours.
IT teams frequently make the mistake of using power supply nameplate ratings in these formulas. A desktop with a 500-watt power supply rarely draws more than 45 watts during typical office tasks. Multiplying fleet counts by power supply ratings inflates energy estimates by five hundred percent.
ACPI Power State Telemetry Modeling
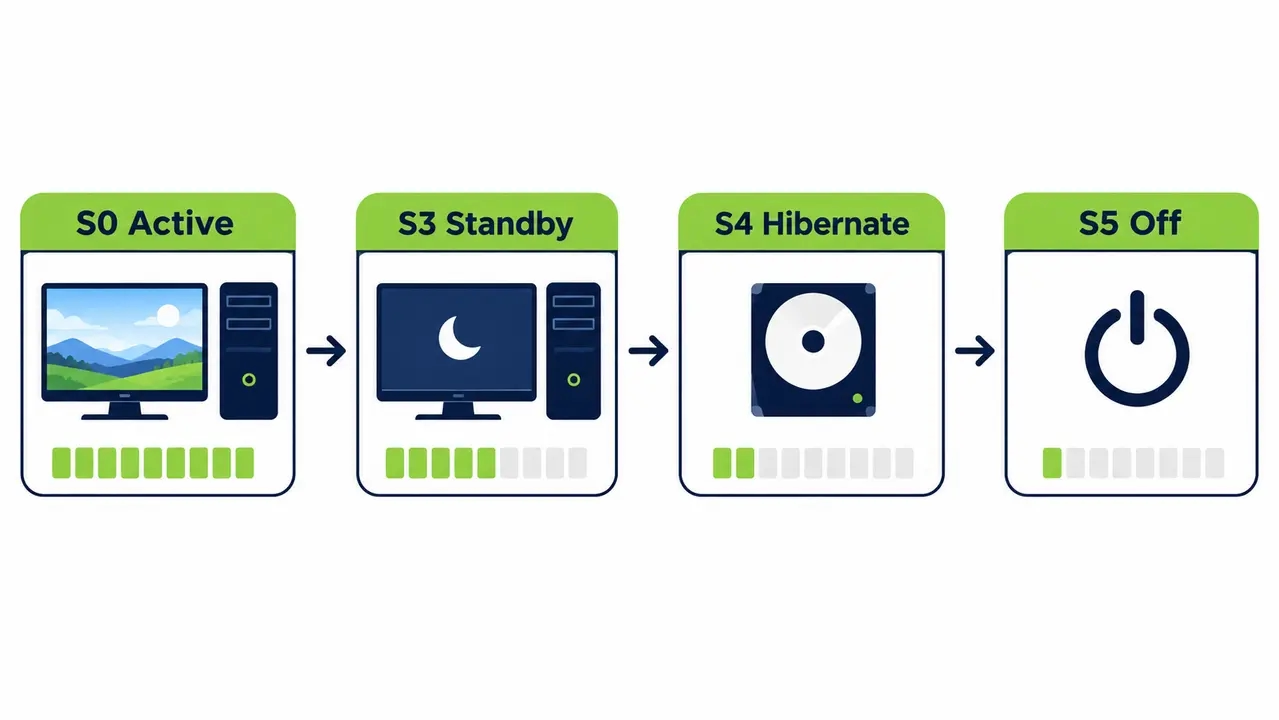
Accurate reporting requires tracking the system power states defined in Microsoft’s power state documentation. In the S0 working state, an enterprise desktop pulls 30 to 90 watts depending on processor load. Modern Standby and S3 sleep states reduce that draw to between 1.5 and 4 watts. S4 hibernate drops draw to 0.5 to 2 watts, while S5 soft off sits below 1.5 watts.
Calculating real annual consumption demands sampling device uptime and power-state transitions across all 8,760 hours of the calendar year. Endpoint telemetry records power-state transitions and operating durations, allowing organizations to estimate electricity consumption using representative power values for each device state. Exact electricity consumption requires direct measurement or independently validated hardware telemetry.
End-User Computing Energy Benchmarks per Full-Time Employee
Measuring energy per device provides technical clarity, but executive leadership often tracks utility consumption per employee. The metric divides total endpoint electricity by the number of full-time equivalent workers. Total electricity includes desktop towers and mobile laptops alongside docking stations, external displays, and departmental kiosks.
Efficient organizations with laptop-heavy hybrid teams consume between 50 and 110 kWh per employee annually. Standard desktop environments with dual monitors consume between 180 and 300 kWh per employee. Intensive environments like trading floors or radiology reading rooms consume 350 to 800 kWh per employee each year.
Interpreting this metric requires normalizing for hardware ratios and shift models. A company issuing both a mobile laptop and a fixed desk terminal will show an elevated per-employee figure despite having efficient machines. Conversely, a hospital operating around the clock spreads one workstation across three nursing shifts. That operational model cuts the per-employee metric by two-thirds without reducing the physical electricity pulled from the wall.
Multi-Tiered Endpoint KPI Framework for IT and ESG Leadership
A successful benchmarking program addresses three distinct organizational audiences with customized key performance indicators. IT operations requires tactical health metrics, sustainability teams require carbon audit data, and financial leaders track cost avoidance.
Core Operational Telemetry for IT Teams
IT administrators track the After-Hours Active Rate. This metric measures the percentage of machines running in the S0 active state between 8:00 PM and 6:00 AM on weekdays. Well-managed fleets keep this figure under five percent, while unmanaged environments regularly see 35 to 60 percent running overnight. Teams also track the Sleep Policy Compliance Rate and log wake failure exceptions caused by conflicting device drivers.
Audit-Grade Carbon Accounting Metrics
Sustainability auditors evaluate total fleet Scope 2 greenhouse gas emissions expressed in metric tons of carbon dioxide equivalent. The GHG Protocol Scope 2 Guidance requires companies to report both location-based and market-based totals. Location accounting reflects physical grid emission intensity where endpoints operate. Market accounting factors in specific corporate renewable energy purchase contracts.
Financial Impact and Avoided Expenditure
Finance directors evaluate annual energy cost per endpoint alongside realized return on investment. Automated sleep enforcement delivers immediate reductions in utility bills without requiring hardware capital expenditure.
Clear operational metrics convert invisible plug loads into accountable financial line items.
Root Causes of Overnight PC Power Waste
Non-working hours account for sixty to seventy percent of total endpoint power consumption across unmanaged corporate networks. This waste occurs because IT procedures and user habits combine to keep machines powered on when offices are empty.
The most persistent operational obstacle is the overnight maintenance window. Systems administrators deliberately disable sleep policies so management tools like Microsoft Configuration Manager can deploy security patches, scan for malware, and run updates. Leaving thousands of computers running all night just to receive a twenty-minute patch burns immense amounts of energy.
Centralized wake-up technology helps organizations coordinate endpoint availability with scheduled maintenance windows. PowerPlug Pro can initiate wake operations for compatible computers before planned maintenance, while Microsoft Configuration Manager or another patch management platform remains responsible for deploying updates, monitoring installation results, and managing reboots. Power policies should be configured to avoid interrupting unfinished maintenance operations.
User behavior creates another layer of power waste. Remote employees often disable sleep settings so they can connect to their office desktops from home. Outdated peripheral drivers and background network polling can also generate wake-locks that prevent the operating system from entering low-power states.
Empirical Power Savings from Modern System Sleep States
Dropping an active desktop from idle into sleep cuts instantaneous power draw by more than ninety-five percent. An idle modern enterprise desktop pulls 35 to 75 watts, while the ACPI S3 sleep state draws only 1.5 to 3 watts.
The mathematics behind this transition show why endpoint power management matters at scale. Consider a fleet of 5,000 corporate desktops with an average 45-watt reduction between active idle and a low-power state. Assuming 14 avoidable hours per weekday and 48 hours each weekend, the annual opportunity is approximately 6,136 hours per computer.
Under these illustrative assumptions, the fleet could avoid approximately 1.38 million kWh annually, equivalent to roughly $207,000 in electricity cost avoidance at $0.15/kWh. Actual results depend on hardware power consumption, maintenance schedules, and successful policy enforcement.
Native Windows Group Policy Objects fail to harvest these savings reliably. Standard group policies apply blunt timeout counters without detecting active background compute jobs or ongoing presentations. When aggressive group policies cause lost work, administrators quickly loosen or disable the enforcement rules.
Average Carbon Footprint PC Fleet Operators Must Account For
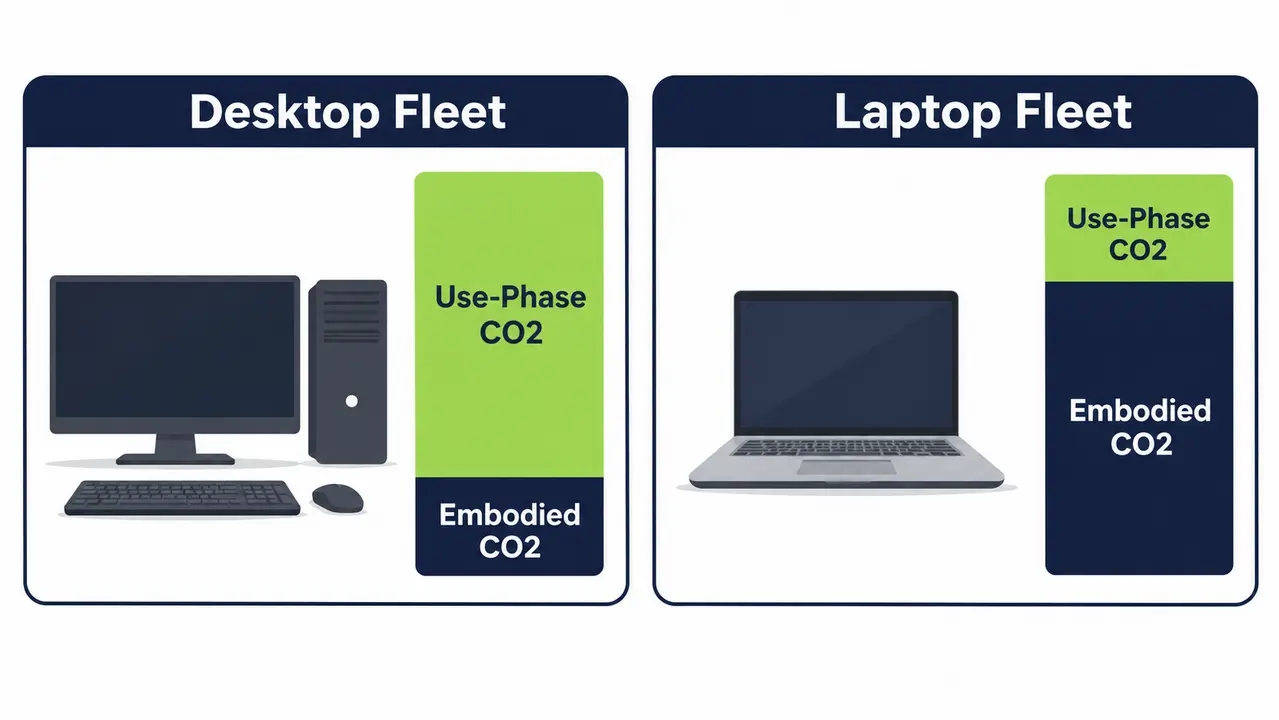
Establishing the average carbon footprint PC fleet managers evaluate requires separating manufacturing emissions from use-phase electrical consumption. A standard business desktop generates between 250 and 500 kilograms of carbon dioxide equivalent across its four-year lifecycle. A corporate laptop accounts for roughly 150 to 350 kilograms over the same timeframe.
Use-Phase Electricity Versus Embodied Carbon
Scope 3 embodied carbon accounts for up to eighty percent of a mobile laptop’s total lifecycle emissions because its components consume minimal operational electricity. Desktop towers and fixed workstations present an inverted emissions profile when left unmanaged. Running a 60-watt desktop continuously generates substantial use-phase Scope 2 emissions that can exceed the device’s original manufacturing footprint over four years.
Where IT Teams Have Direct Operational use
IT teams have zero control over embodied carbon once procurement delivers the hardware. However, technical leadership exercises complete operational control over use-phase Scope 2 emissions through active power management policies.
An unmanaged desktop emits over 100 kilograms of carbon annually, while managed sleep cuts that footprint to under 35 kilograms.
Converting Endpoint Electricity Use into Audit-Ready Scope 2 Emissions
Sustainability compliance frameworks require converting raw electrical consumption into verified greenhouse gas figures using standardized formulas. The standard formula multiplies total endpoint electricity consumption in kilowatt-hours by the regional grid emissions factor.
Location-based emissions accounting relies on physical grid characteristics defined by agencies like the EPA through its eGRID database. If an enterprise burns 100,000 kilowatt-hours of wasted PC power on a coal-heavy electrical grid emitting 0.70 kilograms of carbon per kilowatt-hour, it produces 70 metric tons of emissions.
The exact same 100,000 kilowatt-hours consumed in a region powered primarily by nuclear and hydroelectric generation produces only 15 metric tons. Organizations must document which grid factors they select and maintain consistent historical calculation methodologies across annual audit cycles.
Benchmarking Segmented Fleets Across Desktops, Laptops, and Workstations
Calculating a single average energy consumption number across an entire IT estate creates misleading benchmarks. High-performance engineering workstations distort baseline metrics if grouped together with lightweight administrative laptops.
Fixed corporate desktops represent the most predictable target for power automation because they remain in office cubicles and show high rates of overnight abandonment. Corporate laptops consume minimal power during mobile use, but their docking stations and external monitors draw continuous standby vampire power when left connected. Specialized workstations driving data science models draw hundreds of watts under load and require customized power schedules that never terminate active simulations.
Shared clinical terminals and kiosk workstations present another specialized operational pattern. As this healthcare case study documents, medical facilities successfully automate power savings across thousands of shared clinical PCs by scheduling instant wake cycles that ensure systems are active before morning rounds begin.
Evaluating the IT Emissions per Employee Benchmark
Sustainability directors evaluate the IT emissions per employee benchmark by summing end-user device emissions, on-premises data center allocations, and corporate cloud hosting shares before dividing by total headcount.
End-user computing accounts for a significant portion of this total footprint. A well-optimized digital workplace generates between 15 and 40 kilograms of carbon dioxide equivalent per employee each year from user devices. An inefficient corporate desktop estate pushes that metric past 200 kilograms per employee annually.
Cross-company comparisons require careful normalization for industry workflows. A remote financial advisory firm whose staff uses low-power laptops will naturally post lower emissions per head than an engineering practice running multi-screen graphics workstations. Benchmarking against industry peers is only meaningful when hardware form factors and software compute demands align.
Conducting an Industry Carbon Comparison IT Benchmark
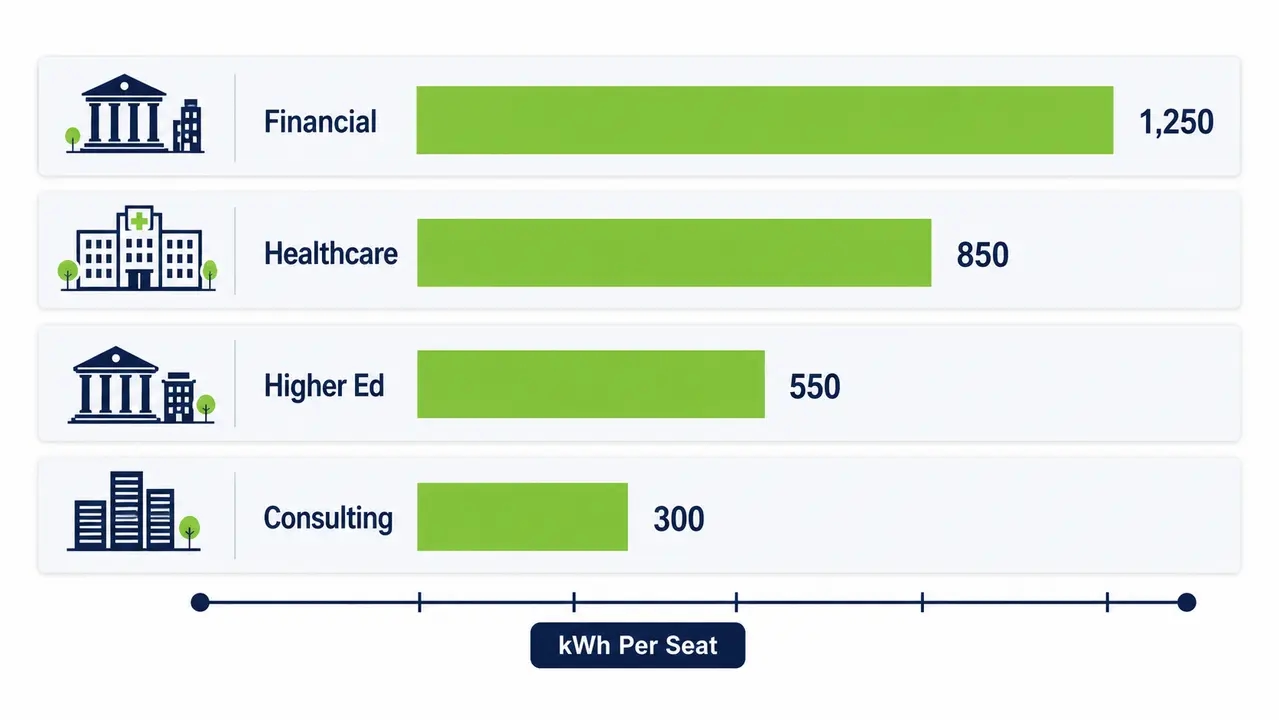
Executing a credible industry carbon comparison IT benchmark requires evaluating operational duty cycles and shift structures rather than employee headcounts alone. Different vertical industries face distinct operational realities that dictate their endpoint energy profiles.
Financial trading floors operate with high desktop density and multiple large displays per user, resulting in elevated energy baselines that require aggressive evening shutdowns to control. Healthcare environments operate critical clinical systems twenty-four hours a day, demanding zero-latency access and granular policy exclusions for emergency diagnostic gear. Higher education institutions maintain large computer labs that sit idle overnight and during semester breaks, offering immense savings through calendar-integrated power schedules.
Comparing energy performance across vertical sectors requires matching operational duty cycles rather than gross revenues.
| Industry Sector | Endpoint Fleet Composition | Baseline Duty Cycle | Typical Annual Energy per Seat | Key Operational Constraint |
|---|---|---|---|---|
| Financial Services & Capital Markets | Fixed Desktops with 3 to 6 Displays | 60 to 70 Hours Active Weekly | 320 to 550 kWh | High multi-screen power draw and compliance audits |
| Healthcare & Clinical Networks | Shared Terminals and Diagnostic PCs | 24/7/365 Continuous Availability | 280 to 480 kWh | Zero-latency emergency access and patient care continuity |
| Higher Education & Academic Labs | Distributed Computer Labs and Kiosks | Irregular Semester Class Schedules | 160 to 320 kWh | Extended idle periods during breaks and night hours |
| Professional Services & Consulting | Mixed Laptops and Shared Hot-Desks | 40 to 50 Hours Active Weekly | 70 to 140 kWh | Mobile worker dock vampire draw and remote connectivity |
Telemetry Architecture for Baseline Measurement
Building a trustworthy energy baseline requires capturing verifiable operational data rather than relying on vendor assumptions. Enterprises need structured telemetry pipelines that track physical machine behavior over extended operating periods.
Minimum Viable Baseline Metrics
Organizations building an initial baseline without specialized software must collect an accurate hardware inventory categorized by form factor and monitor count. IT teams then sample active, idle, and sleep durations across a representative 30-day corporate operating period while pulling commercial utility tariffs from regional power bills.
Continuous Audit-Ready Telemetry
Endpoint telemetry can support sustainability reporting by recording power-state transitions and operating durations. When combined with documented hardware power consumption assumptions, this information can be used to estimate electricity consumption and associated emissions. Such records do not independently verify that a computer was idle, guarantee that logs are immutable, or establish compliance with external audit requirements. Additional measurement and validation may be necessary.
Methodology for Establishing an Unskewed Energy Baseline
Collecting energy data without proper controls leads to distorted baselines that undermine the credibility of subsequent savings reports. Establishing an unskewed baseline requires adhering to a strict measurement methodology.
Technical teams should begin with silent monitoring for thirty to sixty days. Installing monitoring software in a passive state captures authentic user behavior without alerting employees. Announcing energy conservation campaigns beforehand alters user habits temporarily and ruins baseline accuracy.
Monitoring schedules must avoid corporate summer slowdowns, national holidays, and major infrastructure maintenance windows. Teams must also isolate 24-hour security terminals and lab automation hardware into separate tracking groups. Finally, organizations must normalize data for hybrid telework patterns so that fluctuations in physical office attendance are not recorded as power management success.
Five Structural Flaws That Distort Endpoint Benchmarks
Endpoint energy audits regularly collapse because project teams fall into common analytical traps. Avoiding these structural flaws protects the integrity of both financial projections and carbon disclosures.
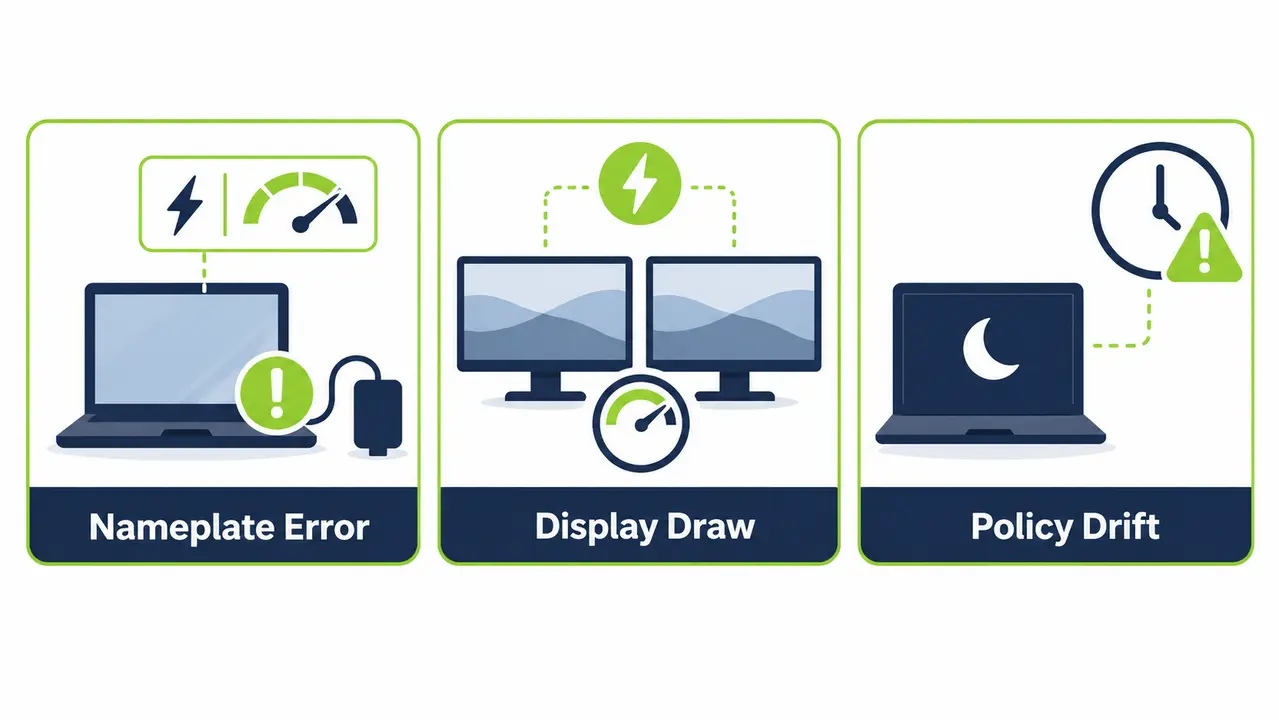
The nameplate wattage fallacy remains the most frequent error. Assuming that an office desktop draws its rated 350-watt power supply capacity inflates energy and carbon estimates by five to eight times. Another frequent blind spot involves ignoring external displays. Dual 27-inch monitors often consume more operational electricity than the compact desktop running beneath them.
Unmonitored policy drift also destroys benchmark accuracy. Network administrators often assume that an Active Directory policy is functioning simply because it was deployed. Faulty peripheral drivers and background software can silently block sleep states on up to forty percent of targeted machines. Changing regional grid emissions factors between audit cycles also obscures whether carbon reductions resulted from operational management or utility decarbonization.
Engineering Playbook for Frictionless Endpoint Power Reductions
Achieving substantial energy reductions without disrupting business operations requires an automated management architecture. Organizations can cut PC electricity costs substantially by deploying structured policies that balance conservation with administrative maintenance.
Deploying a centralized power management platform like PowerPlug Pro gives IT administrators complete visibility and granular control across distributed endpoint environments. The platform integrates directly with Active Directory and Microsoft Configuration Manager to schedule automated sleep and shutdown policies while preserving operational readiness.
IT teams resolve the patching dilemma by scheduling automated wake routines at two in the morning. Systems wake reliably to download security updates, install critical patches, and return to deep sleep once administrative tasks conclude. Organizations achieve full return on investment in as little as 4 months while delivering audit-ready carbon reporting to executive stakeholders.
Enterprise power policies succeed when energy conservation operates invisibly behind IT maintenance workflows.
See how much you could save
We can review your fleet size, hardware mix, and electricity rates with you and produce a written savings estimate for your estate. There is no obligation and you keep the numbers either way.
Frequently asked questions
How does automated power management avoid disrupting overnight security patching?
Enterprise power management platforms can coordinate scheduled wake operations with maintenance windows, allowing compatible computers to become available before planned updates. PowerPlug Pro supports centralized wake management and integration with Microsoft Configuration Manager. The patch management platform remains responsible for executing updates, monitoring installation results, and managing reboots. Administrators should configure power policies to avoid interrupting unfinished maintenance tasks.
Can Wake-on-LAN operate reliably across complex enterprise subnets?
Standard network broadcast packets frequently fail across segmented enterprise subnets because network routers block directed broadcasts. Dedicated power management solutions overcome this limitation by using intelligent local relay agents that receive unicast commands and generate local broadcast packets within each target subnet. This distributed architecture makes wake commands reliable across complex multi-site networks.
What payback period should an enterprise expect from endpoint power management?
The financial payback period for enterprise endpoint power management depends on the number and type of computers, existing electricity consumption, achievable reductions in unnecessary runtime, electricity rates, and implementation and licensing costs. Organizations should establish a representative baseline and calculate expected payback using documented assumptions. Actual return on investment varies between deployments.
How do power management logs support CSRD and Scope 2 compliance audits?
Endpoint power management logs can provide supporting evidence for corporate electricity consumption and emissions estimates by documenting device operating states and durations. Estimating kilowatt-hours also requires representative power consumption values, while calculating associated emissions requires appropriate electricity emissions factors. These calculations can contribute to sustainability reporting, but compliance with CSRD, GHG Protocol requirements, and external assurance procedures depends on the organization’s complete reporting methodology and supporting evidence.
What prevents automated sleep policies from interrupting long-running compute jobs?
Protecting long-running workloads requires appropriately configured power policies and exceptions. Administrators should identify computers performing critical background processing, including engineering builds, database operations, and rendering tasks, and exclude them from sleep or shutdown policies that could interrupt those activities. Automatic workload detection and user deferral options depend on the capabilities and configuration of the deployed management software.
Endpoint energy benchmarking converts an invisible facilities expense into a measurable IT metric. A verified baseline that combines ACPI state telemetry with segmented hardware profiles and normalized per-employee figures produces credible kWh and Scope 2 numbers, while automated sleep and scheduled wake policies turn that baseline into realized savings without disturbing patch windows or user productivity. For a 5,000-desktop estate, the difference between a managed and an unmanaged fleet amounts to well over a million kilowatt-hours and six figures in annual utility cost.

About the author
Nimrod Yedaya
VP Customer Experience
Over 15 years of experience in customer service, technical support, and customer relationships. Nimrod joined PowerPlug in 2012 as Customer Support Manager and was promoted to VP in 2016. He holds an MBA from BIU and a BSc in Communication Systems Engineering from BGU.