
Calculating Enterprise PC Carbon Savings
By Nimrod Yedaya, VP Customer Experience
Walk through a corporate office floor at midnight on a Tuesday. Glowing monitors illuminate empty chairs while cooling fans spin inside thousands of desktop towers that finished their productive workday five hours earlier.
An IT department managing several thousand endpoints often treats this background electricity draw as an unavoidable operational tax. Across 3,000 workstations left running through the night, that unmanaged electricity burn amounts to hundreds of thousands of wasted kilowatt-hours each year.
Calculating accurate greenhouse gas reductions from endpoint power policies requires leaving simplistic online formulas behind. Legitimate Scope 2 reporting demands measuring exact device states, applying regional electricity grid factors, and preserving endpoint availability for scheduled IT security maintenance.
Unmanaged idle hardware is pure operational waste.
Reading time: 5 minutes
How to Calculate CO2 Savings from PC Power Management
The mathematical baseline for computing PC carbon reduction rests on a simple two-stage conversion. First, calculate the total energy saved across your fleet by measuring the wattage differential between unmanaged and optimized power states over the affected hours.
Annual energy saved in kilowatt-hours equals the baseline wattage minus optimized wattage, multiplied by affected hours, divided by one thousand. Multiplying those saved kilowatt-hours by your regional grid emissions factor yields total kilograms of avoided carbon dioxide equivalent.
Computing defensible carbon metrics requires tracking dynamic operational states across enterprise fleets rather than assuming static values. Workstations move between active operation and idle time without user input, and they also enter low-power sleep, disk-based hibernation or complete shutdown.
In an unmanaged enterprise, machines stay active outside work time for roughly 128 out of 168 total hours each week. Targeting those idle hours produces substantial emissions reductions without interrupting active employee workdays.
Organizations achieve consistent reductions by adopting a PC power management platform that automates endpoint transitions across distributed IT networks without disrupting users.
Sustainability leads can cross-reference output totals with the Greenhouse Gas Equivalencies Calculator provided by the EPA to translate raw tonnage into recognizable fleet benchmarks.
Required Inputs for a Computer Carbon Savings Calculator
Inaccurate inputs distort emissions projections and produce sustainability targets your team cannot defend during an external audit. Building a reliable calculation model requires gathering operational and electrical telemetry across four distinct categories.
Fleet inventory serves as the starting foundation. You must separate standard enterprise mini-PCs and traditional desktop towers from high-power engineering workstations and mobile laptops.
Power profiles quantify physical electricity demand in watts for every state a machine passes through, from active workloads and idle time to sleep, hibernation and soft off. Scheduling metrics establish core business hours, weekend periods, and official company holidays.
Utility data provides regional electricity rates alongside local grid carbon intensity factors. Gathering these specific numbers ensures your calculations reflect physical operational conditions.
Minimum Viable Estimates Compared to Telemetry Data
A minimum viable estimate relies on factory specification sheets and standard forty-hour workweek assumptions. This shortcut introduces a large error margin because human behavior rarely matches equipment manuals.
Measurement-based calculations use operating system telemetry logs and physical smart plug metering on hardware samples. Tracking real idle timers and user activity patterns delivers accurate energy figures that satisfy financial auditors.
Overlooked Energy Loads from Displays and Peripherals
Workstation monitors frequently consume significant power while displaying static lock screens during lunch breaks and evening hours. Dual-display setups with two 27-inch screens routinely pull 50W to 70W combined, matching or exceeding the energy consumption of modern micro-desktops.
Desk accessories introduce continuous vampire loads that persist when left unattended. Powered docking stations, external storage drives, and webcams draw electricity all night unless managed by endpoint power policies.
Accounting for 104 weekend days and annual holidays prevents sustainability leads from underestimating the scale of after-hours idle waste.
Formula to Convert PC Energy Savings into CO2e
Converting raw electrical efficiency into verified carbon reductions follows a transparent two-step equation. Step one computes annual fleet energy reduction in kilowatt-hours.
Multiply the baseline wattage minus policy wattage by the annual non-operational hours and total device count, then divide by one thousand. Step two multiplies that annual energy figure by the regional emissions factor to establish total kilograms of avoided emissions.
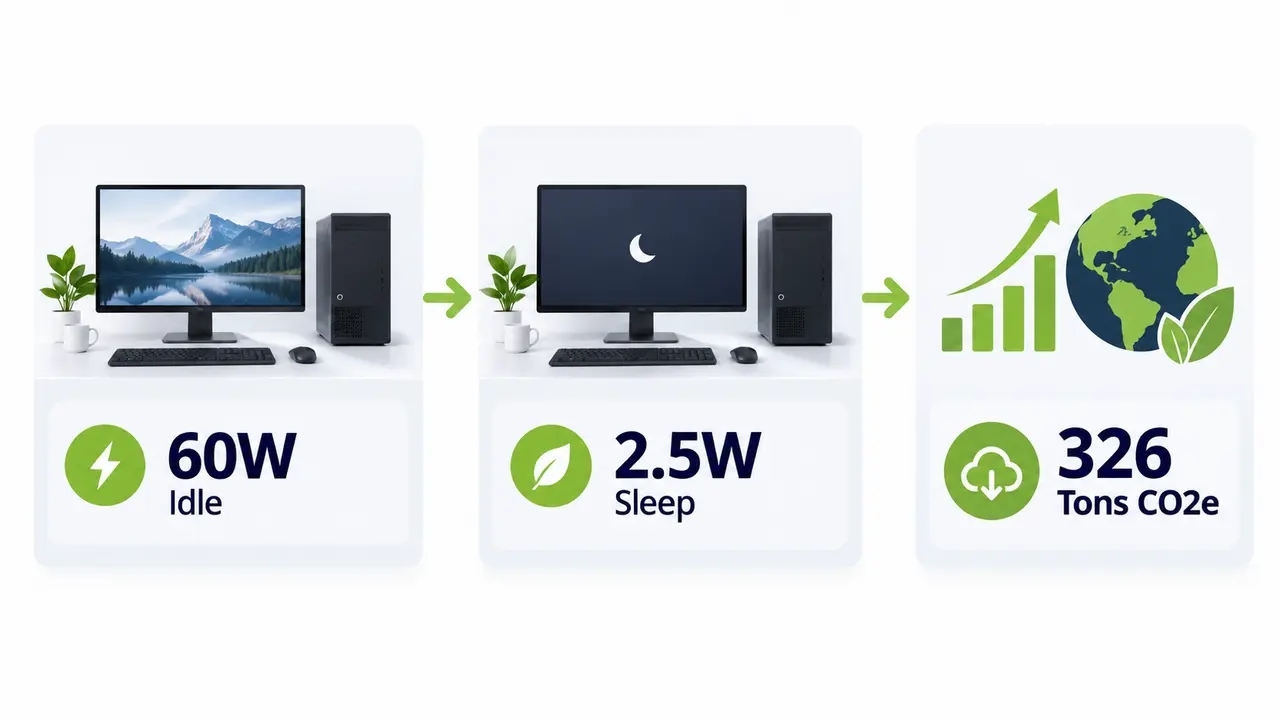
Consider an enterprise fleet of 2,500 desktop computers. Each workstation consumes 60 watts while idling and drops to 2.5 watts in managed sleep mode, creating an energy savings differential of 57.5 watts per machine.
Factoring in 14 non-work hours each weekday and 48 weekend hours identifies 118 wasted hours weekly, which equals 6,136 idle hours per computer annually. Multiplying 57.5 watts by 6,136 hours across 2,500 endpoints produces 882,050 kilowatt-hours saved annually.
At an illustrative grid factor of 0.370 kilograms of CO2e per kilowatt-hour, those 882,050 kilowatt-hours eliminate 326,358 kilograms of greenhouse gas emissions. That reduction equals roughly 326.4 metric tons of avoided carbon emissions.
Metric tons represent the standard reporting currency for enterprise environmental filings.
Controlling Energy Draw with Centralized PC Power Management
Unmanaged office environments rely on voluntary human action or conflicting local operating system timers. Centralized power management applies automated network policies that control hardware states according to organizational schedules.
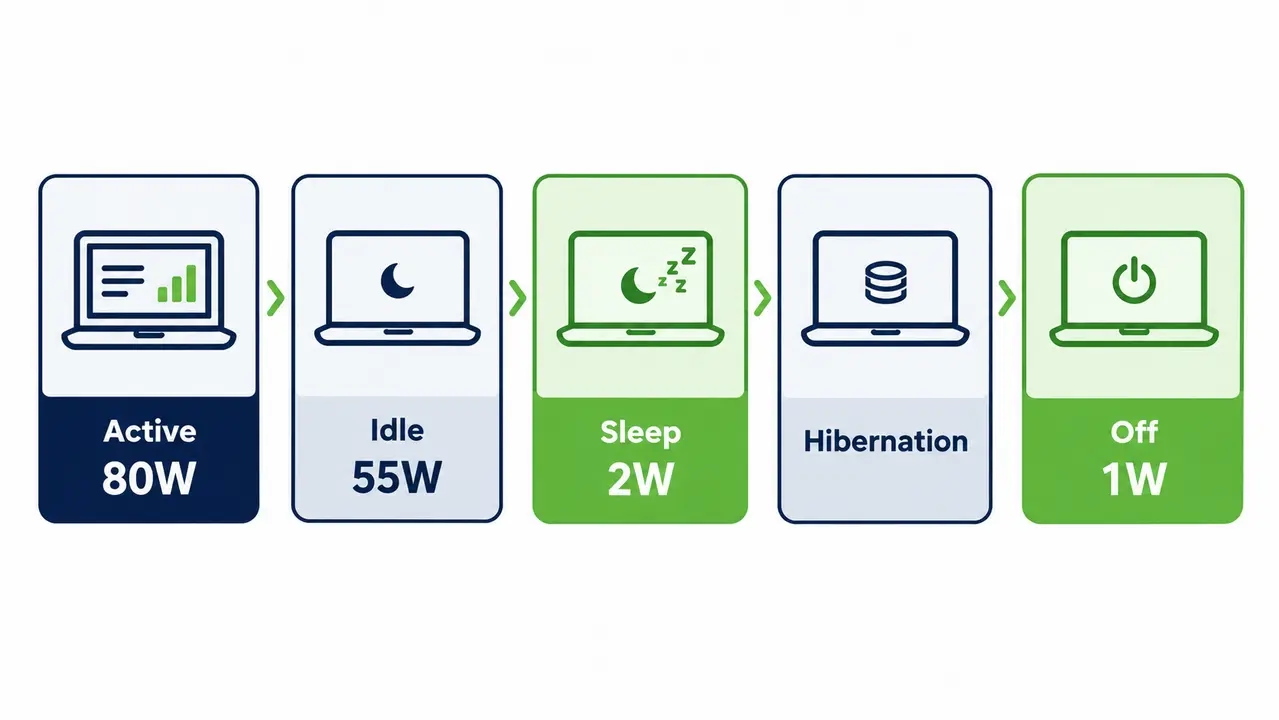
The Advanced Configuration and Power Interface standard defines several distinct hardware operating conditions. Working states pull between 35 watts and 120 watts under active processor loads.
Idle states consume 25 watts to 65 watts while background telemetry and operating system tasks run without active user input. Sleep mode maintains session context in volatile memory while reducing draw to between 1 watt and 4 watts.
Hibernation writes active memory to local storage and cuts power to internal components, pulling between 0.5 and 2 watts. Soft off states draw below 1 watt, powering down the motherboard while keeping network adapters responsive to management triggers.
Corporate computers spend most of their operational life powered on without active user interaction. Background browser processes, operating system telemetry, and scheduled scripts keep modern computers in high-frequency power states when policies are absent.
Federal guidelines on purchasing energy-efficient computers from the Department of Energy confirm that power management policies curtail institutional energy consumption without shortening hardware lifespan.
Sleep Mode Power Savings Compared to Idle Workstations
Many computer users believe sleep mode yields negligible power savings while causing frustrating system freezes upon wake. The physical engineering data refutes this belief entirely.
An enterprise desktop consuming 55 watts during idle periods drops to roughly 2 watts in low-power sleep. That transition eliminates roughly 96% of the endpoint power draw during non-working periods.
Sleep mode keeps open documents, browser tabs, and desktop applications active in volatile memory. Workers return to their active desktop environment within three seconds of pressing a keyboard key.
Modern Standby systems achieve similar power reductions by orchestrating background activity while systems rest. Proper policy enforcement cuts background consumption without degrading user convenience.
Shutdown Compared to Deep Sleep across Enterprise Fleets
The energy difference between low-power sleep and a complete shutdown sits between 1 and 2 watts per workstation. Across a deployment of 5,000 corporate machines, that minor difference accumulates into 43,800 kilowatt-hours of annual consumption.
A common operational myth claims that computer boot cycles draw a power surge that wipes out shutdown savings. A modern computer with a solid-state drive draws slightly elevated power for about thirty seconds while booting, which makes boot energy negligible compared to hours of idle waste.
Uncontrolled shutdowns create significant operational problems for enterprise IT teams. Forcing machines to turn off risks corrupting unsaved user files and severs endpoints from scheduled administrative maintenance windows.
A balanced policy enforces display sleep after 15 minutes of inactivity and transitions machines to system sleep at the end of the business day. Systems can then be awakened for overnight maintenance and returned to low-power states once updates complete.
Specialized systems require specific policy exemptions to maintain continuous uptime. IT teams use Active Directory security groups to exclude clinical monitoring terminals and lab workstations while managing standard office computers.
Annual Carbon Reductions Across Common Workstation Fleets
Fleet carbon reductions vary based on hardware profiles, baseline employee habits, and the regional power grid. The table below illustrates typical annual energy and carbon reduction ranges across common enterprise operating scenarios.
| Operational Fleet Profile | Annual Energy Saved (kWh) | Avoided CO2e (kg) | Baseline Operating Scenario |
|---|---|---|---|
| Low Impact Fleet | 40 to 80 kWh | 15 to 30 kg | Modern laptops, hybrid schedules, cleaner renewable regional energy grid |
| Medium Impact Fleet | 150 to 250 kWh | 60 to 100 kg | Corporate desktop towers, single displays, national average emissions grid |
| High Impact Fleet | 350 to 600 kWh | 140 to 250 kg | High-performance systems with dual monitors, previous 24/7 idle, coal-heavy grid |
Fleet multiplication turns modest per-device savings into substantial organizational benefits. An estimated reduction of 80 kilograms of CO₂e per workstation corresponds to approximately 80 metric tons of avoided emissions across 1,000 systems, assuming the same calculation methodology and operating conditions apply throughout the fleet.
For an organization operating 10,000 endpoints, that annual impact reaches 800 metric tons avoided. That reduction matches the environmental impact of removing hundreds of combustion vehicles from local highways.
Accounting for Monitors and Peripheral Power Draw
Energy audits routinely ignore external displays even though desktop screens pull substantial baseline power. A modern 24-inch office display pulls roughly 25 watts during active illumination and drops to 0.5 watts in standby sleep.
Users often step away from desks while static wallpapers or moving screen savers keep display panels running at full load. Calculating auxiliary savings requires multiplying the active-to-standby display wattage differential by unmanaged idle hours.
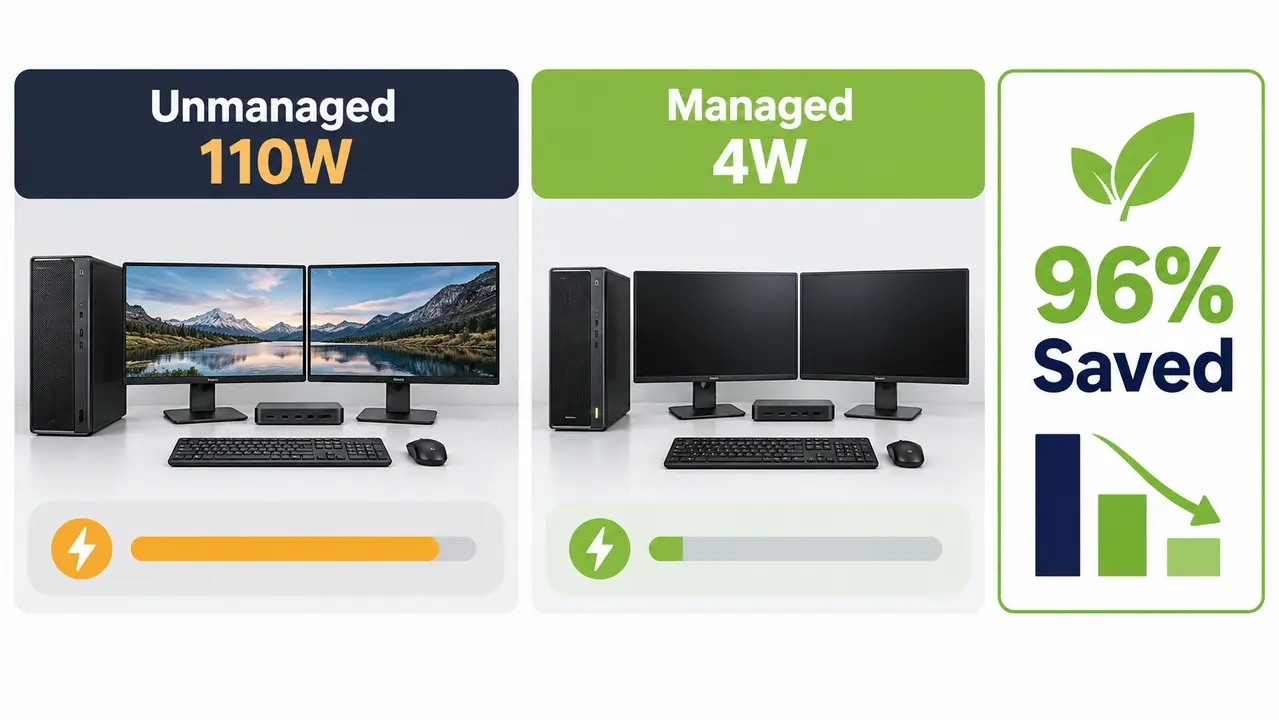
Engineers get clearer results by evaluating total workstation bundles. A standard desk with a 55-watt desktop tower, two 25-watt screens, and a 5-watt docking hub pulls 110 watts while unattended.
Orchestrating power across the full workstation bundle cuts total consumption from 110 watts down to 4 watts during sleep. Screen savers never save electricity because graphics chips render dynamic frames at normal operating power.
Automated display power management ensures screens power down alongside host computers.
Selecting the Correct Regional Electricity Emissions Factor
A carbon emissions factor defines the volume of greenhouse gases emitted per unit of generated grid power. Calculating carbon reductions requires matching energy savings with the specific generation mix supplying your facilities.
The exact same 100,000 kilowatt-hour efficiency achievement produces radically different carbon accounting outcomes depending on where electricity is generated. In regions powered by hydroelectric generation, avoiding 100,000 kilowatt-hours eliminates 5 metric tons of carbon emissions at an intensity of 0.05 kilograms per unit.
In coal-dependent utility regions with an intensity of 0.65 kilograms per kilowatt-hour, that same operational change eliminates 65 metric tons. Applying a generic national emissions factor obscures the genuine environmental outcome of your efficiency project.
Location-Based Compared to Market-Based Accounting
Location-based accounting reflects the average physical greenhouse gas intensity of the commercial electric grid where workstations consume power. Regional datasets like the EPA eGRID database provide verified emission rates for specific geographic power regions.
Market-based accounting evaluates emissions derived from contractual energy procurement agreements. This method accounts for power purchase agreements, renewable energy certificates, and specialized green tariffs.
The formal GHG Protocol Scope 2 Guidance requires large organizations to track and publish both figures for audited ESG filings.
Managing Geographic Multi-Site Inventories
Enterprise organizations operating across multiple states or territories should never apply a single blended national emissions factor. Teams should group workstations by site location and calculate them against regional subgrid factors before consolidating corporate ESG totals.
Distributed endpoint inventories require geographic mapping to ensure that power savings achieved in carbon-heavy grid zones receive accurate sustainability credit.
Measuring Savings Accurately Without Metering Every Desk
Installing physical power meters across thousands of individual office desks is logistically impossible and economically wasteful. IT leaders establish defensible measurement frameworks using standardized verification protocols.
The table below outlines four measurement and verification tiers used across commercial workstation fleets.
| Measurement Strategy | Underlying Data Source | Deployment Effort | Accuracy considerations | Primary Use Case |
|---|---|---|---|---|
| Engineering assumptions | Hardware specifications | Low | Approximate; depends on representative power values | Preliminary project estimates |
| Sample metering | Physical meters on representative devices | Moderate | Depends on sample selection, measurement duration and hardware variation | Validating hardware power profiles |
| Endpoint telemetry | Operating system power-state and activity logs | Moderate | Tracks operating states, not direct electrical consumption | Ongoing fleet activity reporting |
| Hybrid approach | Endpoint telemetry and representative physical metering | Moderate to high | Can improve confidence when supported by documented validation | Financial and sustainability reporting |
Establishing Defensible Measurement Baselines
Engineering teams should run a silent thirty-day baseline monitoring period before enforcing any power policies. Deploying background agents without active enforcement records raw human habits and measures baseline idle waste.
Once policies activate, engineers compare post-enforcement high-draw hours against the initial baseline. This pre-policy window provides empirical proof of performance that satisfies financial directors and carbon auditors.
Why Calculator Carbon Estimates Diverge Across Tools
Online carbon calculators frequently produce conflicting figures for identical equipment inventories. These discrepancies arise because simplified tools rely on hidden mathematical assumptions.
Many legacy web calculators assume desktop towers draw 120 watts while operating, completely ignoring modern energy-efficient micro-form-factor devices. Other calculators assume rigid eight-hour workdays, failing to account for remote working schedules and regional holidays.
Public estimation tools routinely omit external monitors and peripheral hardware loads. Calculators also use outdated national grid averages rather than current regional marginal emissions data.
Software background processes frequently reset operating system idle timers, preventing unmanaged computers from sleeping naturally. IT teams should always review calculator formulas and replace generic assumptions with empirical fleet telemetry.
Calculating Financial Payback Alongside Carbon Reductions
Connecting carbon reduction metrics directly to operating budgets builds a compelling business case for executive leadership. Annual utility cost savings equal total kilowatt-hours saved multiplied by your commercial electricity rate.
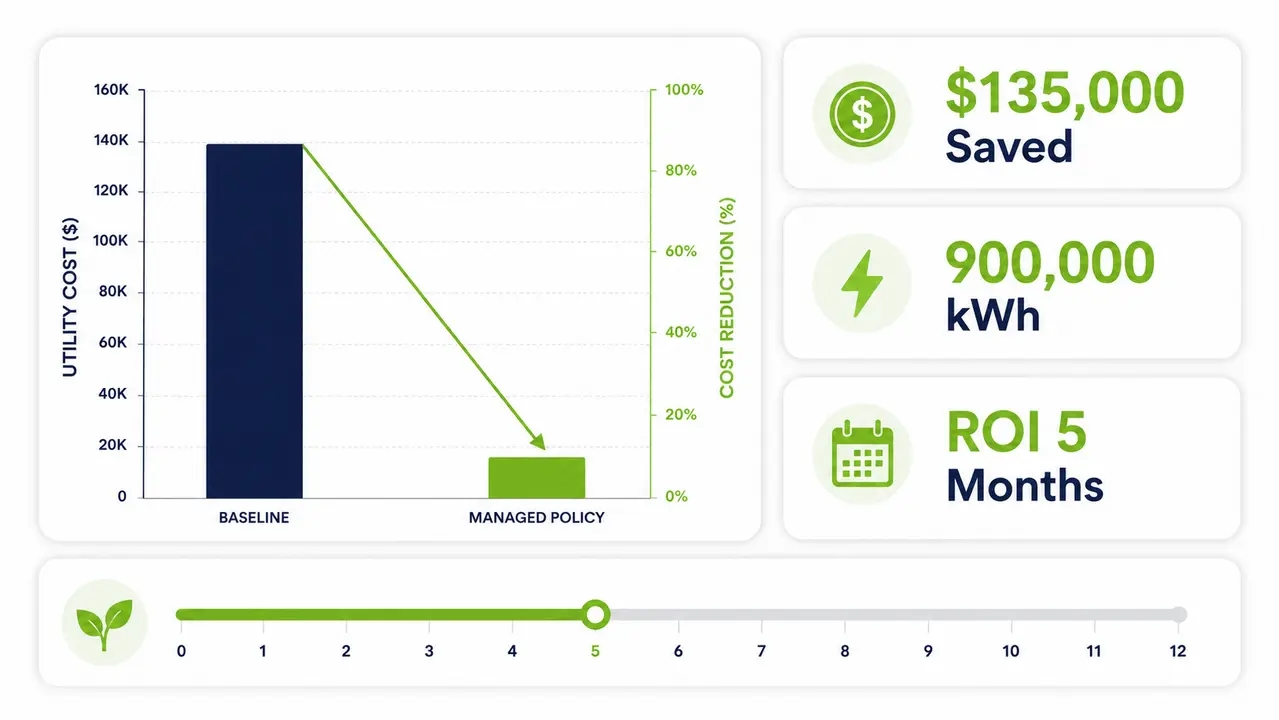
Deploying PowerPlug Pro across 5,000 workstations that save 180 kilowatt-hours per computer eliminates 900,000 kilowatt-hours annually. At a commercial utility rate of $0.15 per kilowatt-hour, operational expenses decrease by $135,000 each year.
At an electricity rate of $0.24 per kilowatt-hour, the same illustrative reduction of 900,000 kWh would represent $216,000 in annual electricity cost avoidance. The actual payback period depends on software licensing, deployment expenses, ongoing administration costs, and the savings achieved in the customer’s environment.
Centralized power policies also curtail peak facility electrical demand. Reducing base load during peak utility pricing windows avoids costly commercial demand surcharges on monthly utility statements.
See the savings for your own fleet
PowerPlug Pro applies centralized power policies across compatible Windows endpoints and reports estimated electricity savings, financial cost avoidance, and associated CO₂e reductions. These estimates use recorded endpoint activity and documented calculation assumptions. Share your fleet size, hardware mix, and electricity rate to evaluate the potential savings in your environment.
Enforcing Power Policies Without Interrupting Maintenance and Remote Access
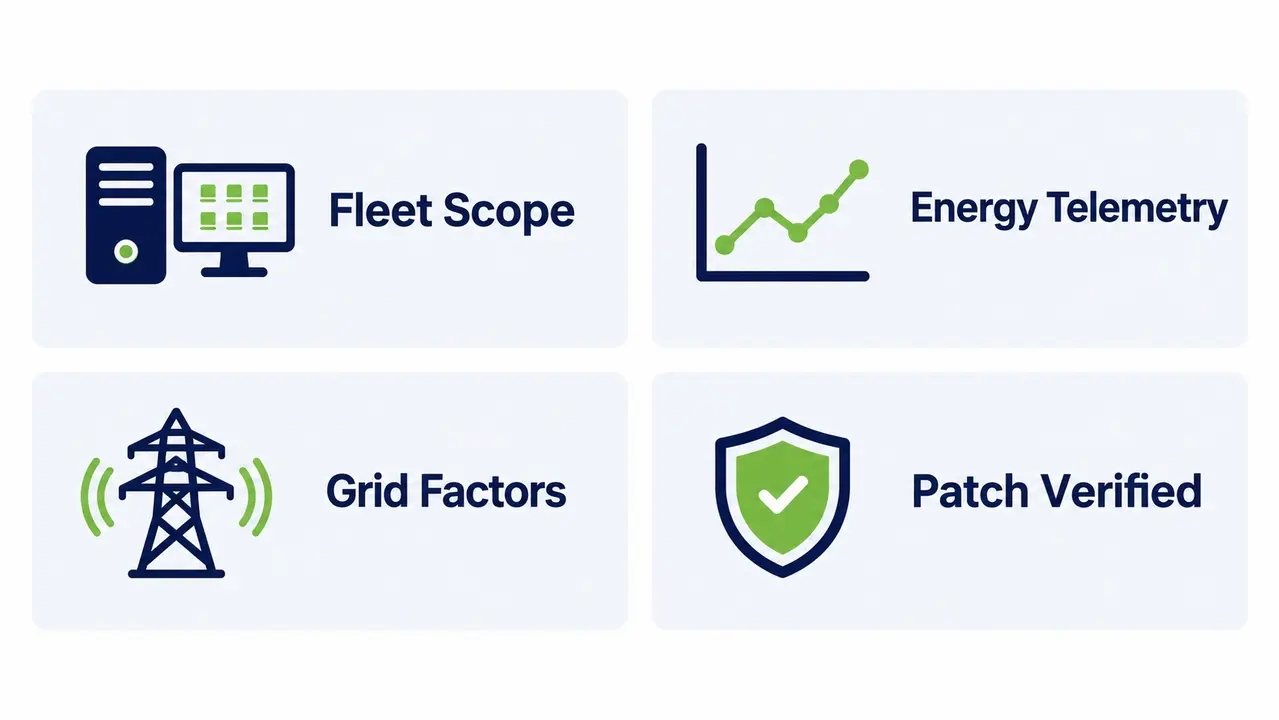
Systems administrators resist automated power policies because unmanaged shutdowns break endpoint maintenance. Sleeping computers miss overnight vulnerability patches, generate deployment failures in Microsoft Configuration Manager, and block remote workers from accessing office desktops.
Solving these operational hurdles requires combining endpoint power orchestration with patented wake-up technology that reaches endpoints reliably across diverse subnets and routed networks.
PowerPlug Pro can coordinate scheduled wake-up operations with enterprise maintenance windows, helping compatible endpoints become available for software deployment. Microsoft Configuration Manager or other supported patch management platforms remain responsible for executing updates, tracking installation results, and managing reboots. Power policies should be configured to avoid interrupting unfinished maintenance tasks.
Hybrid employees wake their assigned office workstations through an on-demand web portal whenever they need remote desktop access from home. Large enterprises show that power efficiency and administrative reliability can work together.
The Clalit Health Services case study demonstrates how tens of thousands of distributed clinical endpoints maintain high security compliance while slashing energy costs.
Structuring an Auditable Endpoint Carbon Report for Leadership
Corporate sustainability auditors and financial executives expect rigorous technical documentation to support carbon reduction claims. A defensible endpoint carbon report begins with an executive summary documenting net kilowatt-hours avoided, financial savings, and total metric tons of avoided CO2e.
The scope boundary must list evaluated hardware profiles while explicitly noting excluded systems like 24/7 server environments and clinical monitors. The methodology section must document baseline measurement dates, post-policy evaluation windows, and cited emissions factor references.
Reporting should break down energy reductions by geographic facility and operating division to give local site managers visibility into progress. The audit report must pair emissions reductions with patch compliance metrics to prove that power policies preserved core network security.
Translating metric tons into visual equivalencies helps communicate success to internal employees while precise figures satisfy regulatory filings.
Reviewing endpoint power logs quarterly keeps your sustainability accounting accurate as hardware inventories evolve.
Frequently asked questions
Will centralized power policies interfere with overnight security patching?
Automated power policies maintain patch compliance by orchestrating Wake-on-LAN triggers alongside your deployment schedules. The platform wakes target computers across subnets prior to maintenance windows, executes necessary updates via Microsoft Configuration Manager or Intune, and returns machines to sleep once installation confirms success. This structured cycle eliminates failed patch jobs while capturing significant energy savings during non-maintenance hours.
Does Wake-on-LAN work across separate enterprise subnets?
Standard Wake-on-LAN packets cannot traverse enterprise network routers and firewall boundaries on their own. Centralized management platforms solve this challenge by designating local network agents that generate directed broadcast packets within each target subnet. This distributed architecture delivers reliable endpoint wake-up across complex corporate VLANs without requiring custom router configurations.
Can remote employees access office PCs if sleep policies are active?
Remote employees can use PowerPlug Pro’s Wake-Up Portal to request that compatible office computers wake before establishing a remote desktop connection. Access is subject to the portal’s configured authentication and permissions. Wake success and resume time depend on the computer’s power state, network connectivity, firmware, and hardware capabilities.
What is the typical payback period for PC power management software?
Most commercial enterprises achieve complete software payback within 4 to 6 months of deployment. A typical corporate workstation fleet saving 150 to 250 kilowatt-hours per computer generates between $20 and $45 in annual utility cost reductions per endpoint. These ongoing operational savings consistently exceed software licensing and administration costs within the first year of operation.
How are PC carbon reductions reported under Scope 2 GHG frameworks?
Credible PC carbon savings estimates combine documented baseline activity, endpoint power-state telemetry, representative hardware power consumption measurements, and appropriate electricity emissions factors. The methodology should identify calculation assumptions, data limitations, and reporting boundaries. These estimates can support Scope 2 reporting, but formal assurance may require additional evidence and independent verification.
Defensible PC carbon savings come from measured baselines, endpoint telemetry, and regional grid factors rather than generic online calculators. The core calculation multiplies the wattage differential between idle and managed sleep states by annual non-work hours, then applies the emissions factor for each facility’s regional grid. Reported alongside verified patch compliance, those numbers give sustainability teams and finance leaders a reduction claim that survives external audit.
Plan the rollout with an engineer
Call us to talk through your endpoint inventory, patch windows, and reporting requirements or to arrange a guided demo of the platform in action.

About the author
Nimrod Yedaya
VP Customer Experience
Over 15 years of experience in customer service, technical support, and customer relationships. Nimrod joined PowerPlug in 2012 as Customer Support Manager and was promoted to VP in 2016. He holds an MBA from BIU and a BSc in Communication Systems Engineering from BGU.