
PC Power Monitoring for Carbon Reporting
By Nimrod Yedaya, VP Customer Experience

Walk through an enterprise office floor at eleven at night, and you will see hundreds of darkened computer monitors. Under each desk, the workstation mini-tower runs with its internal fans humming and power supply drawing continuous current from the wall. Those machines sit untouched until eight the next morning, drawing fifty to eighty watts continuously while waiting for human interaction.
Multiply that idle load across five thousand endpoints, and your organization consumes hundreds of thousands of kilowatt-hours every year for empty cubicles. Energy waste at that scale drains operating capital and inflates your greenhouse gas ledger during an era of strict corporate sustainability disclosure rules.
Auditors and corporate stakeholders no longer accept broad facility utility estimates as adequate proof of efficiency gains. Real environmental compliance requires exact endpoint telemetry that maps hardware states directly to regional grid emission rates. This guide details how enterprise IT and sustainability teams deploy power consumption monitoring, automate Scope 2 carbon accounting, and eliminate idle waste without disrupting maintenance windows.
Idle hardware produces zero business output.
Reading time: 5 minutes
Power consumption monitoring carbon reporting defined
Power consumption monitoring for carbon reporting combines endpoint power-state activity with documented hardware power consumption estimates to calculate electricity usage and associated greenhouse gas emissions. These calculations can support organizational Scope 2 reporting and energy-efficiency initiatives. Unless electricity consumption is measured directly, the resulting kilowatt-hour and emissions figures remain estimates rather than measured electrical consumption.
The core mechanism tracks how a computer moves through four power states, from active runtime and passive idle to sleep and soft-off. Software agents log the exact duration spent in each operational state and calculate total electricity consumed based on measured or calibrated hardware profiles. The system aggregates those values into kilowatt-hour totals across days, weeks, and fiscal quarters.
Converting raw energy into carbon figures requires multiplying total kilowatt-hours by verified regional emission factors. These factors account for the specific mix of fossil and renewable generation feeding the electrical grid where each computer operates. The resulting carbon dioxide equivalent figures provide the Chief Sustainability Officer with verifiable proof of corporate emissions.
This automated approach changes the relationship between IT operations and sustainability compliance. Instead of relying on facility-level estimates based on office square footage, organizations produce device-level activity logs that satisfy external regulatory audits. The same records give finance leaders the proof of power savings they need alongside sustainability targets.
Energy data required to produce fleet carbon reporting
Building an audit-ready IT carbon inventory requires four primary data streams collected continuously from every managed workstation. Organizations must capture how long each device spends in each power state and the calibrated wattage for that state, then add aggregate electricity consumption over fixed reporting windows and contextual metadata. Missing any single component turns your carbon filing into an unverified estimate.
Each endpoint must report its unique machine identifier, hardware chassis model, and exact timestamps for every state transition. Operating systems record each move from active user engagement into passive idle, where applications run without human input, and on into low-power sleep or shutdown. Software monitors these states continuously to calculate real energy consumption.
Contextual metadata assigns operational power to specific business units and geographic regions. Your tracking system must record where every workstation sits and which departmental cost center it belongs to, along with its subnet assignment and device ownership status. This organizational attribution allows finance teams to allocate utility costs accurately while enabling regional grid factor alignment.
Different enterprise stakeholders demand specific outputs from this collected dataset. IT operations teams review sleep policy compliance and anomalous active uptime that suggests hanging background processes. Finance managers analyze net kilowatt-hour reductions to reconcile regional utility expenditures, while sustainability directors extract time-stamped emissions values matching standard corporate reporting calendars.
What good enough looks like for a first ESG report
Organizations starting their sustainability tracking journey should follow a structured three-stage maturity framework rather than attempting perfect laboratory measurement immediately. The first stage focuses on fleet-wide baseline estimation, applying published hardware energy profiles against active and idle operating system timestamps. This provides immediate visibility across thousands of computers without physical hardware metering.
The second stage introduces calibrated estimates using representative physical measurements. IT teams measure selected workstation models under typical operating conditions and use those results to refine hardware power consumption assumptions. This improves the reliability of the calculations but does not guarantee compliance with financial or sustainability audit requirements.
The third stage introduces automated calculations using documented electricity emissions factors appropriate to each reporting location and period. These estimates can support corporate sustainability disclosures when combined with transparent methodologies, defined reporting boundaries, and appropriate validation. External audit acceptance depends on the applicable reporting standards and assurance procedures.
| Telemetry Stream | Primary Technical Source | Stakeholder Purpose | Audit Significance |
|---|---|---|---|
| Power-State Duration | OS kernel event logs and ACPI timers | IT operations uptime monitoring | Verifies operational runtime hours |
| Calibrated State Wattage | Chassis hardware profiles and lab samples | Engineering load modeling | Provides defensible energy conversion |
| Aggregate Energy (kWh) | Calculated product of duration and load | Finance and utility accounting | Direct activity data for Scope 2 |
| Location Metadata | Active Directory OU and subnet mapping | Sustainability and regional ESG | Determines correct regional grid factors |
How to convert kWh into CO2e for automated carbon calculation
Automated carbon calculation follows a clear mathematical equation that links device electrical load directly to global atmospheric impacts. Activity data in kilowatt-hours multiplied by the regional electricity emission factor yields total emissions expressed as kilograms of carbon dioxide equivalent. Automating this calculation requires feeding time-sliced endpoint energy consumption directly into processing engines mapped to external factor databases.
The formula needs three variables, namely the total energy consumed over the reporting interval and the regional grid emission factor for local generation assets, plus global warming potential metrics for trace greenhouse gases. These trace gases include methane and nitrous oxide released during fossil fuel combustion at the power plant. Combining these components yields a standardized carbon metric.
Spreadsheet reporting cannot withstand formal sustainability audits.
Manual spreadsheets fail because enterprise computer fleets change constantly through refreshes, redeployments, and department transfers. Spreadsheets apply static annualized grid assumptions that ignore regional generation shifts and seasonal power supply variations. Telemetry-driven systems run continuous calculation pipelines that match monthly endpoint power consumption against official factor updates, such as the EPA eGRID summary data framework used across American power markets.
Difference between location-based and market-based electricity emissions
Corporate accounting standards require organizations to evaluate purchased electricity using two distinct methods. The location-based method calculates emissions using average energy generation intensities of the physical regional grid where electricity is consumed. It reflects the real physical emissions resulting from local power generation plants supplying that service area.
The market-based method evaluates emissions based on specific contractual arrangements made with energy suppliers. These instruments include renewable energy certificates, power purchase agreements, and specialized green power tariffs negotiated by facilities teams. Enterprise reporting systems should export both figures simultaneously so sustainability officers can fulfill comprehensive compliance requirements.
The role of endpoint power monitoring in Scope 2 reporting
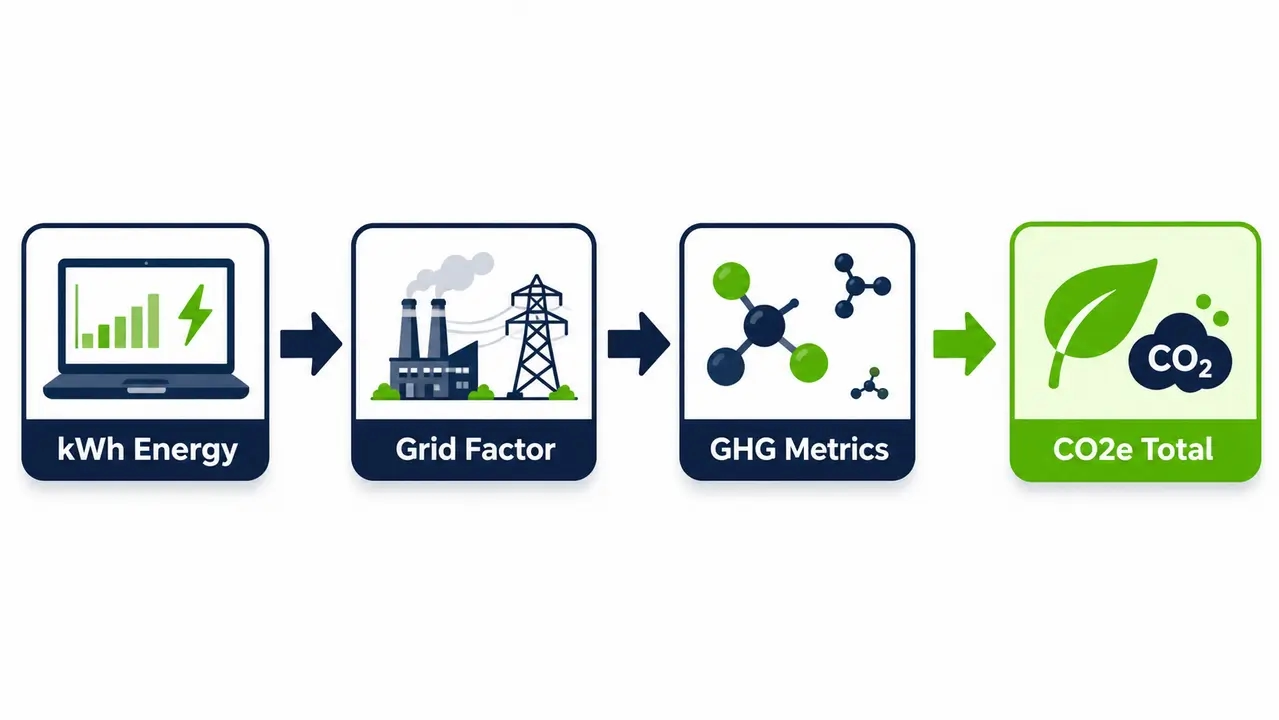
Scope 2 reporting covers indirect emissions associated with purchased electricity, steam, heating, and cooling consumed by an organization. Endpoint power monitoring can help estimate the portion of electricity consumption attributable to managed computers by combining recorded power-state activity with representative hardware power values. This provides supporting evidence for evaluating the impact of IT power policies, but it is not equivalent to direct electrical submetering or independent verification of emissions reductions.
Facility utility bills capture one aggregate figure covering heating and ventilation, lighting and elevators, and tenant hardware. Relying solely on utility bills forces sustainability managers to estimate IT power through crude square-footage allocations. Granular endpoint telemetry replaces arbitrary estimates with verified runtime records derived directly from workstation operating systems.
This granular verification protects your organization during external financial and sustainability audits. When an enterprise claims credit for operational carbon reductions, auditors require documented evidence proving those drops did not result from milder weather or reduced office occupancy. Detailed reporting aligned with the formal GHG Protocol Scope 2 guidance proves that computer policy adjustments caused the documented energy drop.
Emission tracking PC fleet vs carbon accounting software
Enterprise carbon accounting software operates as an aggregated top-down ledger system designed to compile broad operational activity across Scope 1, Scope 2, and Scope 3 disclosures. These platforms ingest utility bills, travel receipts, and procurement invoices to report broad footprint numbers to executive boards. They record historical environmental impact, but they cannot reach inside operating systems to change device behavior.
In contrast, an emission tracking PC fleet system acts as an operational bottom-up sensor and control platform. It resides directly on desktop hardware, monitoring power states and actively applying policy enforcement to eliminate unnecessary runtime. While accounting ledgers document past waste, endpoint platforms eliminate it before electricity is purchased.
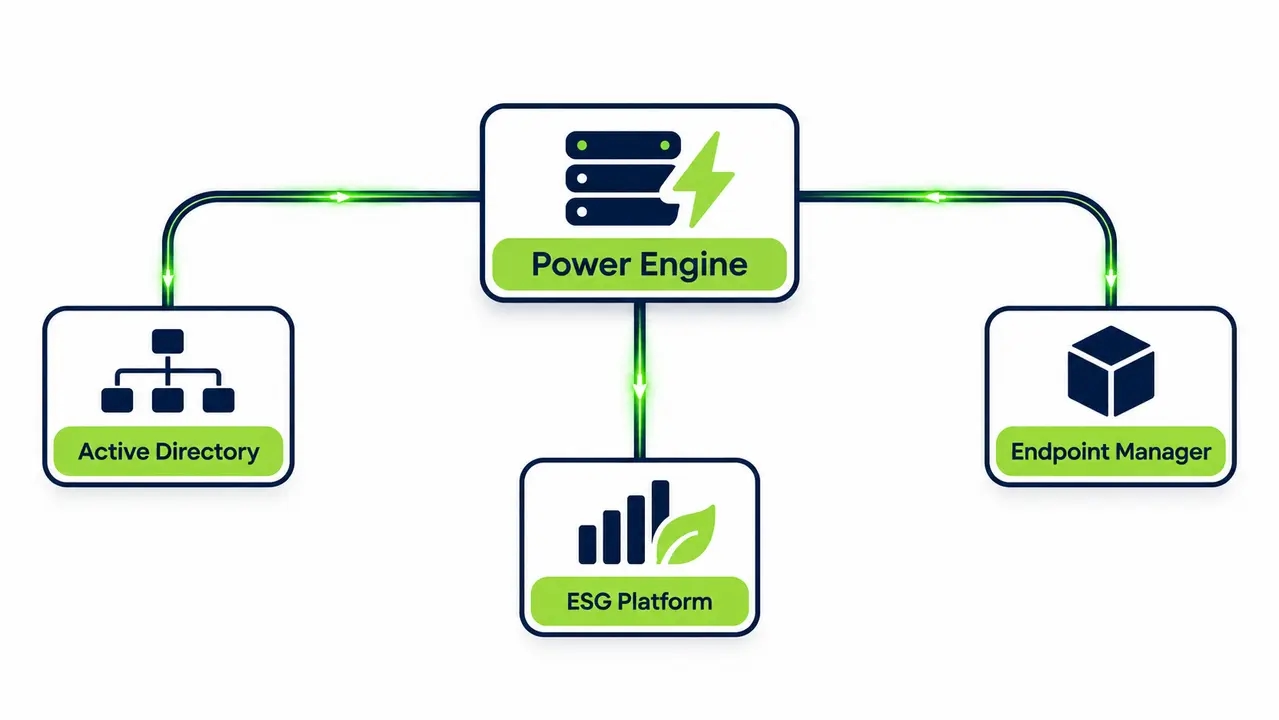
Endpoint monitoring tools serve as high-resolution operational feeders for broader sustainability suites. The endpoint agent tracks active computing hours and turns them into monthly kilowatt-hour totals, then applies location-specific emission rates before exporting clean reporting packages into corporate sustainability databases. This gives executive teams verified data without manual translation.
Accuracy of automated carbon calculation from endpoint power data
Automated carbon calculations based on operating system power states and calibrated hardware profiles can provide useful estimates of endpoint electricity consumption and associated emissions. Their accuracy depends on the quality of hardware power measurements, the representativeness of sampled devices, and the completeness of activity records. These estimates should not be treated as equivalent to direct electrical measurements without documented validation. Suitability for external sustainability reporting depends on the applicable reporting and assurance requirements.
Physical smart plugs provide the highest electrical precision for an individual wall outlet, measuring voltage fluctuations and power factor in real time. However, installing physical meters across ten thousand distributed office desks and remote home workspaces is logistically impossible and prohibitively expensive. Physical meters also introduce potential failure points into corporate electrical distribution.
Pure software telemetry models run at enterprise scale with zero additional hardware expense. These systems monitor operating system power states and CPU utilization levels along with connected peripheral profiles, then match those states against tested hardware baseline curves. Calibrating these software curves through sample physical testing produces an ideal hybrid approach that satisfies audit rigor across extensive workstation estates.
Desktop monitors and peripheral docking stations must be modeled alongside workstation base units. A dual-monitor executive setup drawing thirty watts per display significantly increases total desk consumption during active hours. Sophisticated tracking tools model attached displays based on display sleep timers and USB power states to ensure reported energy totals reflect true desk draw.
Documentation requirements for audit readiness
Independent auditors examine calculation methodologies just as thoroughly as final carbon numbers. To ensure your reported figures withstand inspection, your IT organization must document the exact source and version of all applied electrical emission factors along with their release year. Keeping an unedited archive of factor tables ensures retrospective calculations can be verified years later.
Your team must maintain written records of the hardware sampling methodology applied across chassis families. Document how baseline wattage figures were established for each standard laptop, desktop, and performance workstation deployed across the enterprise. Finally, publish clear boundary declarations that state active inventory counts and logging exception windows and list any excluded systems.
Core metrics for an ESG and finance power consumption dashboard
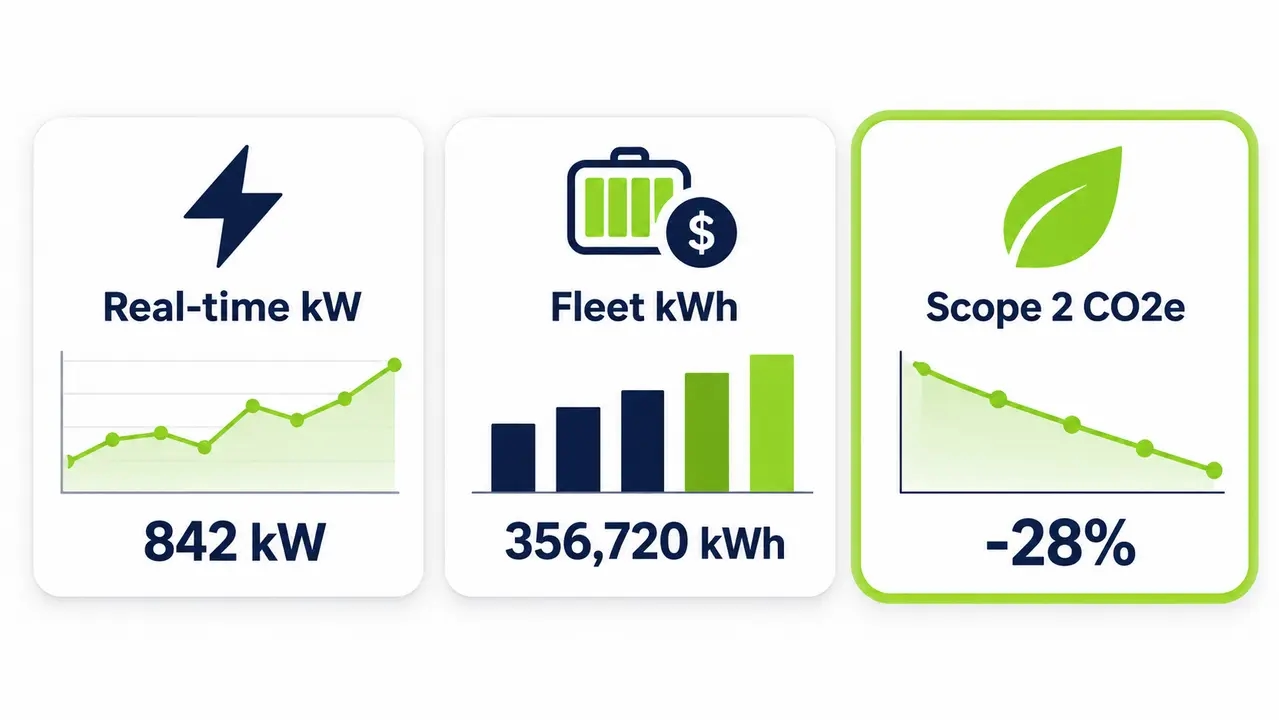
An enterprise energy dashboard must present unified hardware telemetry through three distinct administrative perspectives. IT operations leaders require real-time electrical draw in kilowatts to assess current fleet operational status and identify systems failing to enter low-power states. Finance teams require accumulated kilowatt-hour metrics and currency calculations to verify operational bill reductions against regional utility tariffs.
Sustainability directors need time-stamped carbon metrics displayed against established baseline years. The interface should highlight instantaneous fleet power loads alongside historical trends over selectable rolling timeframes. Tracking after-hours electricity waste between seven in the evening and six in the morning shows executive teams exactly where unmanaged power drains corporate budgets.
The dashboard must track policy health and fleet compliance percentages across organizational units. Flagging systems that remain continuously awake uncovers rogue background processes, broken display drivers, or unapproved peripheral devices that prevent natural operating system sleep. Automated exports should deliver scheduled reports to department managers via email or direct business intelligence connectors.
Why traditional PC power policies fail at enterprise scale
Most corporate IT teams attempt to manage workstation power using built-in Windows Group Policy Objects or basic operating system sleep timers. These native tools are blunt instruments that lack contextual awareness of user tasks, causing them to fail within enterprise environments. Employees quickly find their long-running database queries or compile jobs terminated by rigid timers.
Energy policies fail when they disrupt working employees.
When native sleep settings interrupt active work, users push back against IT leadership. Employees request administrative exemptions, run media players on endless loops, or deploy unauthorized mouse-jiggler utilities to force machines awake. Within months of deploying standard operating system sleep policies, compliance rates drop as exceptions spread across departments.
The operational divide between security teams and energy goals creates even greater friction. IT operations engineers intentionally disable operating system sleep timers to ensure workstations remain powered on overnight for vulnerability scanning, patch distribution, and operating system upgrades. If computers sleep when centralized deployment systems push critical security updates, maintenance failure rates climb, leaving the enterprise exposed to cyber threats.
Native operating system tools also lack centralized reporting telemetry. Group Policy pushes settings down to endpoints, but it provides zero operational feedback showing whether computers actually entered sleep mode or remained running. IT leaders remain blind to fleet power draw, unable to verify savings or calculate emissions reductions for executive leadership.
Better carbon reporting outcomes through intelligent endpoint power management
Enterprise endpoint power management helps reduce unnecessary computer runtime while accommodating different operational requirements. Administrators can configure power policies, schedules, and appropriate exceptions for critical workloads. Protection against sleep during CPU-intensive tasks, disk activity, or background applications depends on the specific capabilities and configuration of the management software.
PowerPlug Pro supports centralized power policies and scheduled wake operations for compatible Windows endpoints. Administrators can coordinate these capabilities with enterprise maintenance windows while validating that critical applications and business processes are not interrupted.
Scheduled wake operations can help make computers available before patch deployment begins. The patch management platform remains responsible for executing updates, tracking installation status, and managing required reboots. Computers should not be forced into low-power states while protected maintenance operations remain incomplete. Actual energy savings depend on device behavior, supported wake states, and the organization’s operating schedules.
Modern platforms log device transitions across standard Advanced Configuration and Power Interface states. Tracking transitions between working runtime and low-power ACPI states generates the exact operating duration logs required for mathematical emissions verification. This granular operational monitoring turns standard PC fleets into reliable environmental sensor networks.
Tracking emissions for remote workers and hybrid laptops
The rapid expansion of hybrid and remote working models complicates corporate carbon boundary accounting. Workstation laptops draw power from multiple electrical grids as they move from corporate headquarters to home Wi-Fi networks and travel destinations. Tracking remote device energy requires local endpoint agents that log power states regardless of where the machine connects to the internet.
Local endpoint agents record battery charging cycles, active system usage, and low-power durations while disconnected from corporate networks. When the laptop reconnects to corporate systems, the agent uploads cached operational telemetry to the central database. The calculation engine estimates power draw based on specific battery charging curves and hardware performance profiles.
Attributing remote electricity consumption requires clear corporate carbon accounting rules. Organizations generally adopt one of two established boundary definitions for remote hardware. Under the primary facility assignment rule, remote devices remain assigned to the employee’s designated corporate office, maintaining operational Scope 2 boundary consistency.
Under the regional grid assignment rule, remote energy consumption is mapped to the employee’s home state or country grid average. Many organizations report this remote home electricity consumption under Scope 3 Category 7, covering employee commuting and teleworking. Establishing transparent boundaries and documenting your assumptions matters far more to financial auditors than attempting to measure individual home electrical sockets.
Establishing baselines for power consumption monitoring and carbon reporting
An operational energy baseline represents a measured period of normal enterprise activity during which endpoint telemetry is recorded without active power-saving policies. This pre-intervention benchmark typically spans fourteen to thirty consecutive operational days. It establishes the baseline energy consumption against which all post-policy kilowatt-hour reductions and avoided carbon emissions are measured.
Selecting the baseline window requires careful operational calendar evaluation. Baseline periods must avoid corporate holiday shutdowns, major seasonal weather extremes, or unusual business disruptions that artificially distort hardware usage patterns. Capturing clean baseline data ensures executive stakeholders accept post-rollout savings calculations as legitimate business gains.
Savings calculations evaluate the exact mathematical delta between baseline energy draw and current operational draw across equivalent machine populations. The calculation engine subtracts post-policy kilowatt-hours from baseline values, applying identical regional grid emission factors to both figures. Once established, baseline profiles must be permanently locked within the system to maintain reporting consistency during multi-year audits.
Baseline mistakes that distort ROI and emissions figures
A common mistake in IT carbon reporting involves failing to normalize fleet population changes over time. Comparing a baseline captured across five thousand computers against a post-policy environment that grew to six thousand devices distorts performance figures unless normalized to average kilowatt-hours per endpoint. Professional platforms automate this per-device normalization.
Failing to account for seasonal calendar variations also skews energy validation. Comparing summer operational energy against winter baselines introduces external distortion from corporate schedule shifts and seasonal grid intensity variations. Fleet managers must also guard against survivorship bias by properly accounting for decommissioned workstations and newly deployed chassis profiles.
Typical energy and carbon savings across enterprise PC fleets
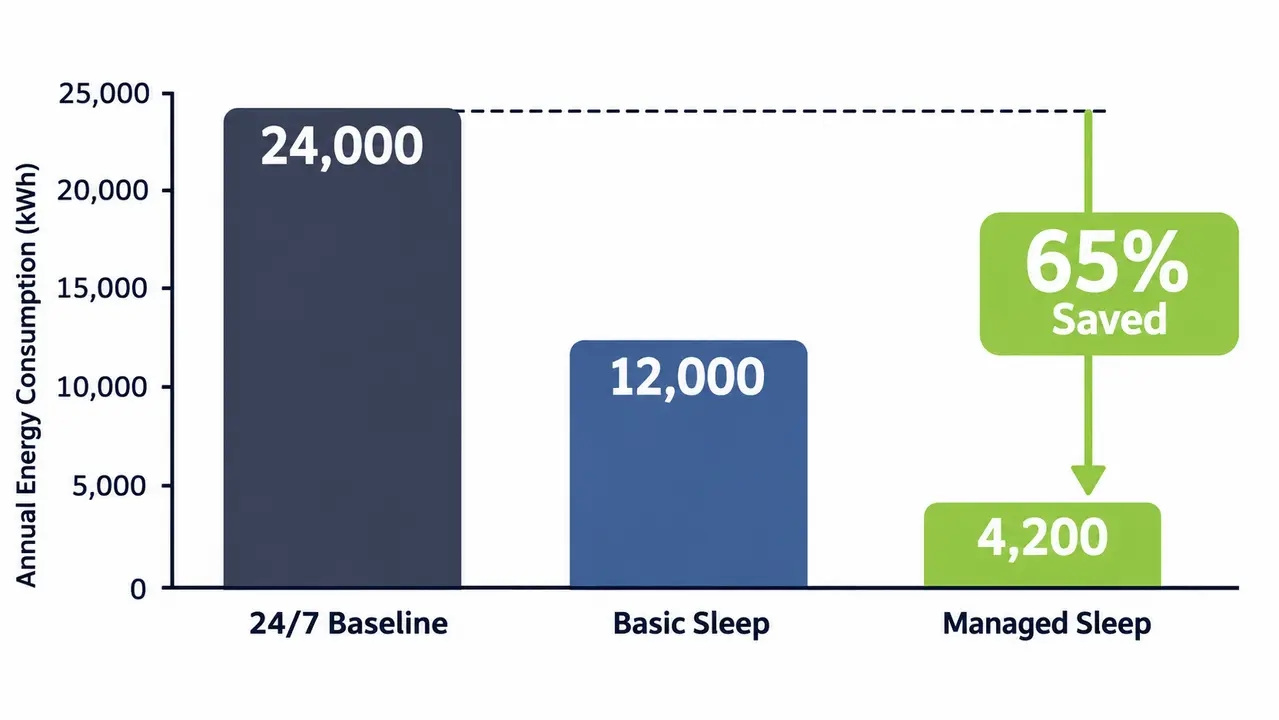
Enterprise organizations that actively eliminate after-hours PC waste reduce total fleet electricity consumption sharply. When computers transition from unmanaged overnight runtime to automated sleep, the financial and carbon reductions materialize immediately on utility accounts. These reductions deliver tangible returns without requiring expensive physical facility modifications.
Consider an enterprise operating five thousand desktop workstations that historically remained powered on overnight, wasting fourteen hours of idle runtime every weekday and forty-eight hours over the weekend. Automated sleep policies recapture more than three thousand hours of wasted runtime per machine annually. That operational shift eliminates hundreds of thousands of kilowatt-hours from corporate utility bills.
Hybrid organizations with high laptop densities also capture substantial operational reductions. While laptops consume less raw power than desktop towers, unmanaged laptops connected to dual external monitors and docking stations draw twenty to thirty-five watts indefinitely. Automated display sleep and managed charging policies eliminate significant cumulative energy waste across extensive mobile fleets.
| Illustrative Scenario | Annual kWh per 1,000 PCs | Annual Cost ($0.14/kWh) | Estimated Emissions (MTCO₂e) |
|---|---|---|---|
| Unmanaged baseline: 60 W average, 24/7 | 525,600 | $73,584 | 194.5 |
| Basic power policies: 36 W average | 315,360 | $44,150 | 116.7 |
| Optimized endpoint management: 21 W average | 183,960 | $25,754 | 68.1 |
Calculation assumptions: 1,000 computers, 8,760 hours annually, $0.14/kWh, and an illustrative electricity emissions factor of 0.37 kg CO₂e/kWh. Average wattage values represent assumed annualized power consumption, including low-power periods. Results are illustrative, not guaranteed outcomes. Actual energy savings and maintenance reliability depend on endpoint configuration, policy compliance, supported wake states, and operational requirements.
See what your fleet is wasting overnight
We can measure your unmanaged baseline and run intelligent sleep policies on a representative sample, then hand you the kWh and CO2e deltas and the cost savings your finance and sustainability teams can verify.
Running a seven-day pilot for PC power monitoring
A seven-day pilot can provide an initial assessment of endpoint power behavior, deployment compatibility, and potential savings across a representative workstation sample. However, a short evaluation cannot establish definitive annual savings or validate all operational scenarios. Organizations should use a sufficiently representative baseline and managed-policy observation period, accounting for weekdays, weekends, maintenance cycles, and variations in employee activity before extrapolating results across the entire fleet.
Days one through three focus purely on passive baseline measurement. IT teams deploy lightweight agents using Microsoft Configuration Manager or Intune without enabling power-saving policies. The software runs silently in the background and logs untouched runtime and idle durations along with after-hours energy waste across normal enterprise work cycles.
On day four, administrators activate initial non-disruptive power policies across the pilot group. Settings apply gradual idle sleep transitions after confirmed user inactivity, while keeping systems awake during core business hours. Days five and six monitor operational continuity, validating that automated wake routines fire correctly during scheduled maintenance and that employees experience zero workflow interruptions.
Day seven extracts comparative performance metrics and compiles the executive evidence pack. The system calculates the exact energy delta between the baseline window and the managed period, extrapolating those results across the full enterprise inventory. This evidence pack provides finance and sustainability executives with verified numbers needed for full deployment approval.
Key components of an executive pilot evidence pack
An executive evidence pack must present operational data that satisfies both financial controllers and sustainability directors. The report opens with net kilowatt-hours consumed during the managed period compared directly against baseline metrics across identical computer populations. This establishes the physical foundation for all financial and environmental claims.
The pack translates physical energy reductions into localized financial savings based on your corporate utility contracts, extrapolating those figures across the total desktop inventory. It details avoided carbon emissions using verified regional grid factors, while displaying IT help desk operational metrics that confirm zero support tickets were created during the evaluation period.
Enterprise infrastructure integrations that matter for reporting
Endpoint power platforms must integrate smoothly into core enterprise IT infrastructure to avoid administrative overhead. Modern solutions link directly to directory services like Active Directory and Microsoft Entra ID. Ingesting organizational units, departmental groups, and location tags automates machine classification and enables internal cross-charging for energy consumption.
Integration with endpoint management systems governs silent agent deployment and configuration synchronization. The software agent must install cleanly through standard enterprise packaging pipelines without requiring endpoint reboots or manual technician visits. Once installed, it synchronizes policy definitions and caches operational telemetry locally during network disconnects.
Ensuring maintenance tasks succeed requires reliable patented wake-up technology capable of traversing enterprise subnets without triggering broadcast storm alarms. Advanced wake engines awaken machines across complex virtual local area networks and 802.1X secure ports without requiring network router reconfiguration. Once maintenance scripts terminate, endpoints return safely to low-power sleep.
Organizations may need to export endpoint activity and estimated energy consumption data into business intelligence or sustainability reporting systems. The available export formats, APIs, and third-party integrations depend on the selected power management platform and its supported interfaces. PowerPlug Pro’s integration capabilities should be evaluated against the organization’s specific reporting and security requirements.
Security and privacy architecture for endpoint energy monitoring
Enterprise information security teams inspect all endpoint monitoring agents before granting deployment authorization. Security officers must confirm that software agents collect strictly machine-level operational telemetry rather than monitoring employee behavior. Power tracking logs hardware power states and processor utilization levels along with system timers but never captures keystrokes, application contents, or user data.
Software agents must maintain a near-zero operational footprint on host operating systems. The local monitoring service should consume less than one percent of CPU capacity and minimal system memory, operating silently without degrading workstation performance. All local event databases must be cryptographically protected to prevent tampering or unauthorized telemetry modification.
Communications between endpoint agents and centralized administrative servers must be encrypted with transport layer security. The platform must implement role-based access control, restricting administrative permissions such as remote wake execution and policy adjustment to authorized technical personnel. Comprehensive audit logs track all configuration changes to support compliance with SOC 2 and GDPR as well as enterprise governance frameworks.
Structuring carbon reporting energy data for external audits
Preparing IT energy records for third-party carbon audits requires a structured and repeatable monthly documentation package. External assurance providers examine device inventories, calculation methodologies, and source data lineage before certifying Scope 2 emissions figures. Providing organized records prevents costly audit delays and eliminates reporting disputes.
Unverified estimates belong in drafts, not regulatory filings.
Your monthly audit package must include standardized columnar activity records exported from the tracking platform. Each record should document the machine identifier and its assigned physical office location for the reporting calendar month, together with total operating hours in each power state and the calculated kilowatt-hours. Maintaining this granular ledger proves the integrity of your reported baseline figures.
Alongside the activity data, organizations must provide formal documentation of all applied emission factors. This documentation includes factor source names, regional sub-grid designations, and published release cycles. Audit binders should conclude with boundary declarations that define managed device counts, identify excluded testing hardware, and explain operational anomalies like office consolidations.
What to look for when evaluating PC power management software
Selecting an enterprise endpoint power platform requires evaluating technical capabilities beyond basic sleep timers. Enterprise software must prove its scalability by managing tens of thousands of distributed workstations without server degradation or network latency. Platforms must deliver non-intrusive policy enforcement that prevents workflow interruptions while capturing maximum energy savings.
Look for systems that provide complete calculation transparency rather than closed carbon estimates. Technical teams must have the ability to inspect underlying mathematical formulas, adjust hardware wattage profiles, and update regional electricity emission factor tables as regulatory standards evolve. Platforms lacking transparency fail external financial and environmental audits.
Operational synchronization with enterprise maintenance routines remains a primary procurement requirement. The software must integrate directly with centralized update tools, waking sleeping endpoints for patch distribution and returning them to low-power states when administrative tasks finish. Without this automated synchronization, IT security engineers will inevitably block power management initiatives.
Enterprise platforms like PowerPlug Pro operationalize this entire pipeline within a unified administrative console. The software combines advanced endpoint power management, automated baseline calculation, and audit-ready ESG reporting designed for demanding enterprise environments. A verified healthcare case study shows how large distributed organizations enforce power policies across mission-critical endpoints without impacting operational workflows.
Turn endpoint telemetry into audit-ready reports
Tell us about your fleet size and reporting requirements, and we will map out a pilot that fits your maintenance windows and produces the documentation your auditors expect.
Enterprise IT networks carry significant operational complexity, yet cutting endpoint electricity waste remains one of the fastest ways to lower corporate operating expenditures. Capturing device-level power telemetry gives technical leaders the verified data needed to prove environmental progress and defend Scope 2 reductions. Moving from manual estimates to automated endpoint monitoring provides immediate financial savings while establishing audit-ready sustainability compliance across your entire organization.
Frequently asked questions
What is the difference between real-time watts and kWh reporting?
Watts measure instantaneous electrical power draw at any single moment, showing how much energy a workstation consumes right now. Kilowatt-hours measure total energy consumed over time by multiplying power draw by elapsed operating hours. Carbon reporting and electric utility billing are always calculated on cumulative kilowatt-hours rather than instantaneous watts.
Can IT energy savings be used for carbon credit generation?
In almost all corporate environments, IT energy reductions are applied directly toward lowering Scope 2 market-based and location-based footprint disclosures. They do not typically generate tradeable carbon offset credits on voluntary markets. Reducing operational electricity use provides immediate utility cost savings and verifiable progress toward corporate net-zero targets.
Does endpoint power management interfere with remote desktop access?
Enterprise power management can support remote employees through scheduled or on-demand Wake-on-LAN capabilities. PowerPlug Pro provides a Wake-Up Portal that allows authorized users to request wake operations for compatible office computers before establishing a remote desktop connection. Wake reliability depends on the computer’s hardware, firmware, network configuration, and supported power states. A standard Remote Desktop connection does not automatically trigger a PowerPlug wake operation unless a specific integration has been configured.
How often should electricity emission factors be updated in the system?
Electricity emission factor tables should be updated annually to align with official regulatory publications from bodies such as the EPA or national energy agencies. Updating factor sets yearly maintains calculation accuracy and ensures consistency with corporate financial and sustainability reporting calendars.

About the author
Nimrod Yedaya
VP Customer Experience
Over 15 years of experience in customer service, technical support, and customer relationships. Nimrod joined PowerPlug in 2012 as Customer Support Manager and was promoted to VP in 2016. He holds an MBA from BIU and a BSc in Communication Systems Engineering from BGU.