
Electricity Rate Optimization Data Heavy Organizations: A Guide for Peak Cost Control
A practical framework for IT and facilities leaders who need to turn fleet-wide power data into lower, more predictable electricity bills.
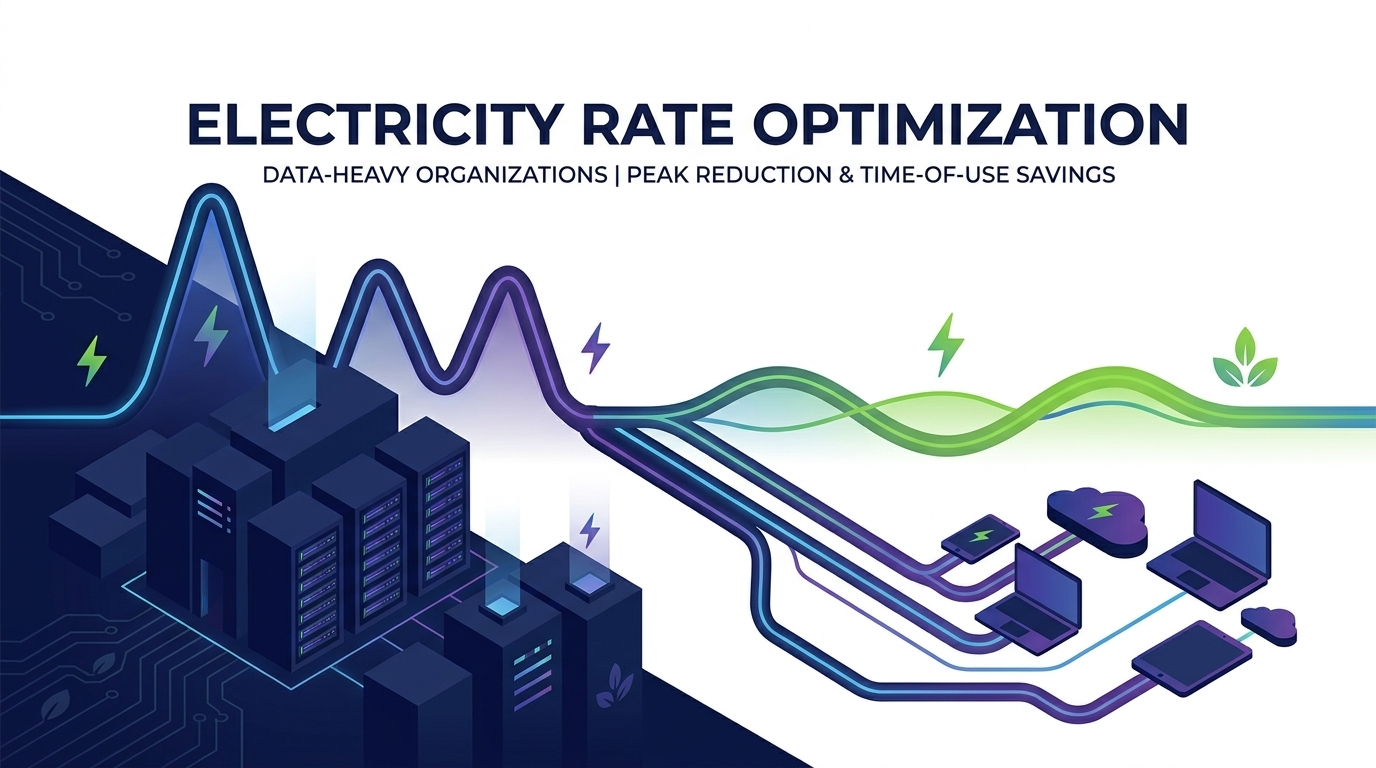
Electricity rate optimization data heavy organizations pursue today hinges on one thing: turning granular power data into contract leverage. When compute, storage, and endpoint fleets run around the clock, the electricity bill stops being a fixed overhead line and becomes a variable that can be actively managed. This guide walks through how rate structures work, where hidden load typically hides, and the workflow that turns a rate audit into ongoing savings.
Article NavigationTable of Contents
- Electricity rate optimization is a data problem before it is a negotiation problem — you need visibility before you can act.
- Demand charges and time-of-use windows often drive more of the bill than the per-kWh commodity rate itself.
- Endpoint fleets (desktops, laptops, monitors) are frequently excluded from rate analyses even though they run continuously.
- A structured, repeatable audit workflow turns one-time savings into a sustained reduction in effective rate.
Why Rate Design Determines the Real Cost of Compute
Most organizations track electricity spend as a single monthly total, which hides the structure that actually determines the bill. Utility rate schedules are built from several layered components — a commodity charge for energy consumed, a demand charge tied to peak load, and increasingly a time-of-use multiplier that prices the same kilowatt-hour differently depending on when it is drawn. For data-heavy organizations running servers, cooling, and large device fleets continuously, these components interact in ways a flat “cost per kWh” view never surfaces.
Electricity rate optimization for data-heavy organizations starts with separating these components and asking, for each one, whether current operating patterns are working with or against the rate structure. A workload that runs at a steady, moderate level all day can look identical in total kWh to one that spikes sharply for two hours — but the two can produce very different bills once demand charges and time-of-use pricing are applied.
How Time-of-Use Pricing Reshapes a Normal Workday
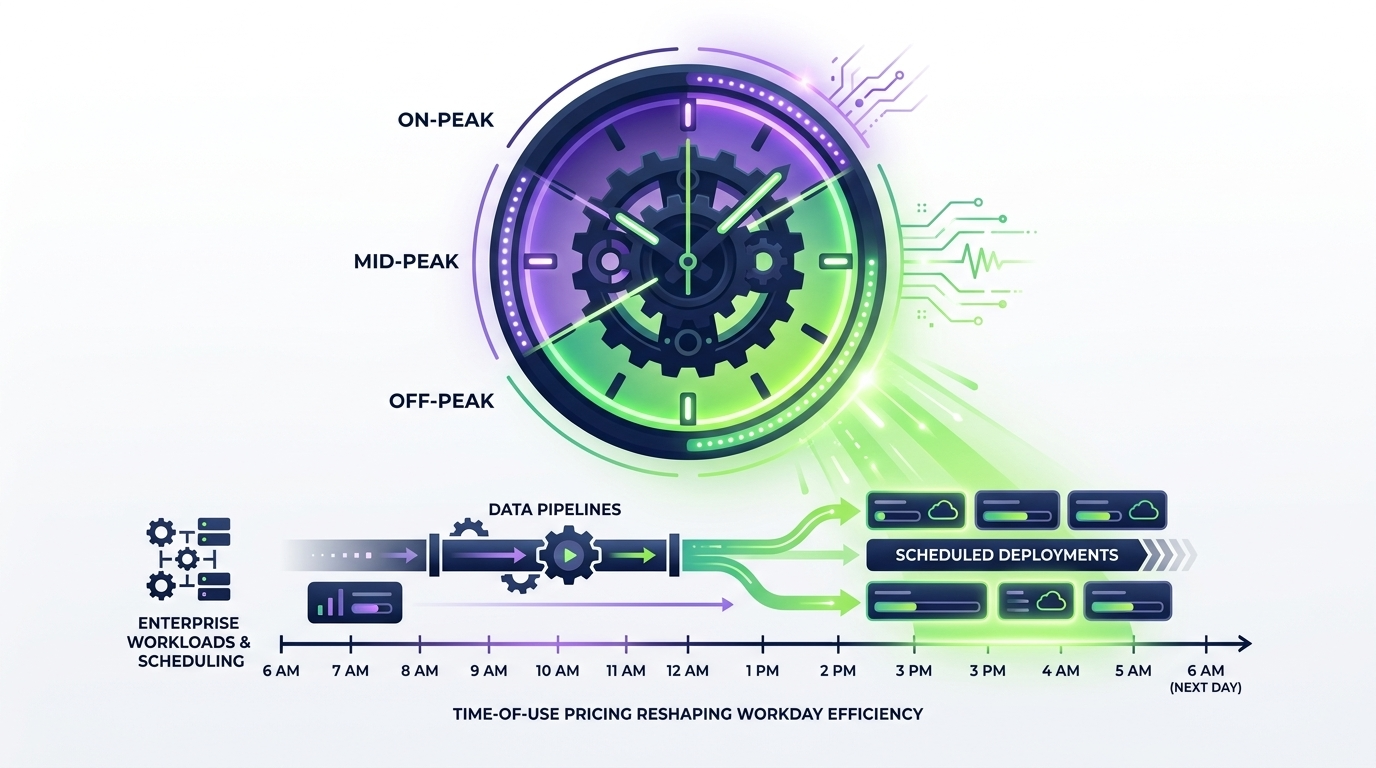
Time-of-use pricing assigns different rates to the same energy depending on the hour it is consumed, typically with a premium during afternoon and early-evening peak windows when grid demand is highest. For an organization running standard business hours, that peak window often overlaps directly with the busiest part of the workday — the hours when servers, workstations, displays, and HVAC systems are all drawing power simultaneously.
The practical effect is that a workload shifted even a few hours earlier or later can move out of the priciest pricing tier entirely. Batch processing, backups, patching cycles, and non-urgent compute jobs are natural candidates for this kind of shift because they rarely need to run at a specific minute — only within a window. Reviewing which processes are schedule-flexible is often the fastest way to see where time-of-use exposure can be reduced without touching headcount or hardware.
- Map current peak-hour usage against the utility’s published time-of-use windows.
- Identify workloads and device-level tasks that do not require real-time execution.
- Shift schedule-flexible processes outside peak windows where operationally safe to do so.
See Fleet-Wide Power Data in One View
PowerPlug helps enterprise IT teams centralize PC and endpoint power data so rate optimization decisions are based on real usage, not estimates.
See the PlatformRunning a Rate Optimization Audit: A Four-Step Workflow
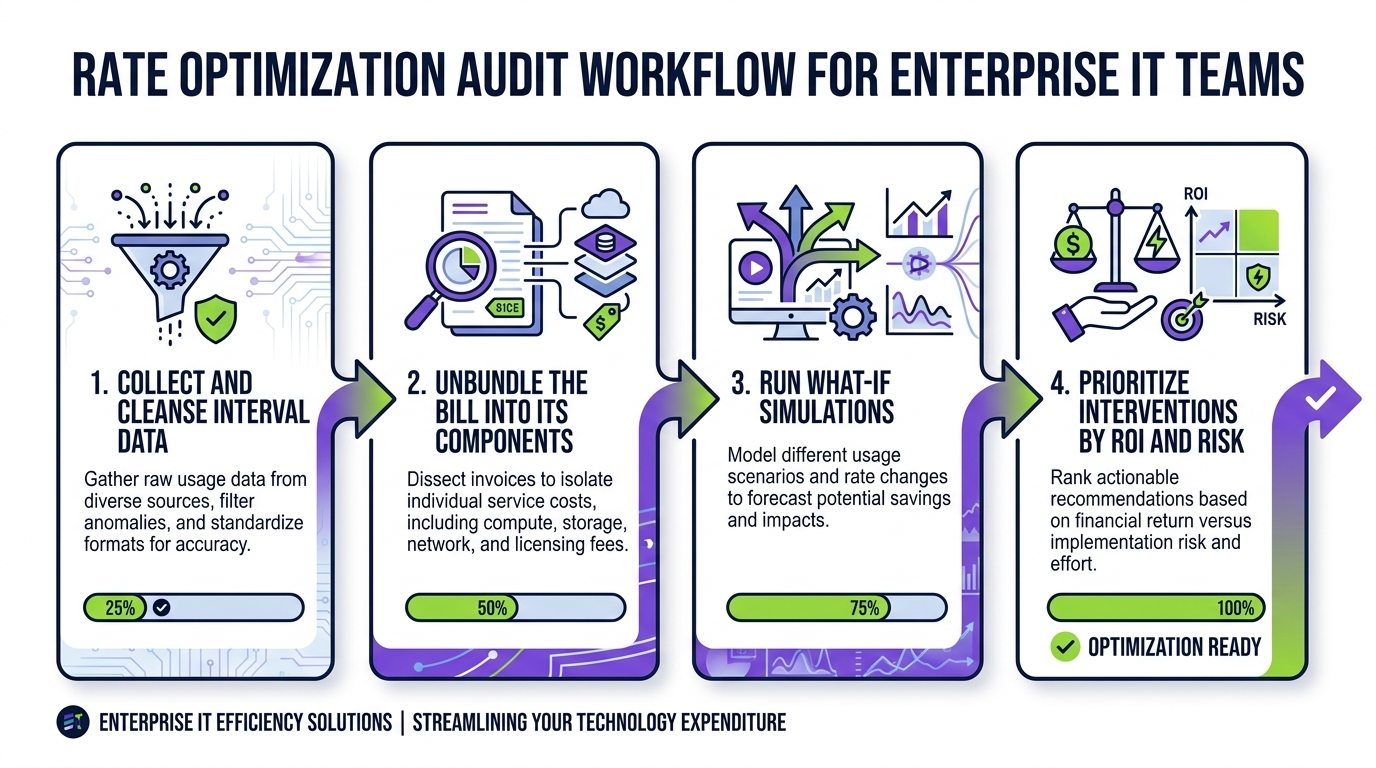
A one-off rate review provides a snapshot, but electricity rate optimization for data-heavy organizations works best as a recurring workflow, since usage patterns, headcount, and utility tariffs all change over time. The following four-step structure keeps the process repeatable rather than a rebuilt project every time.
Step 1 — Collect Granular Usage Data
Pull consumption data at the most granular interval the utility and internal systems allow, broken down by time of day rather than only monthly totals. Without this level of detail, demand spikes and time-of-use exposure are invisible.
Step 2 — Map Usage Against the Current Rate Schedule
Overlay the usage data on the exact rate schedule in effect, including demand charge thresholds and time-of-use windows, to see where the organization’s own behavior is triggering the most expensive pricing tiers.
Step 3 — Identify Shiftable and Reducible Load
Separate load into three categories: fixed (cannot move), shiftable (can move in time), and reducible (can be lowered through settings, sleep policies, or scheduling). This categorization is where endpoint fleets, not just data center infrastructure, become relevant.
Step 4 — Re-Baseline and Repeat
After changes are implemented, re-measure the effective rate and repeat the cycle. Utility tariffs and organizational usage both drift over time, so a single audit rarely stays optimal for more than a year.
Endpoint Fleets: The Load Most Rate Analyses Ignore
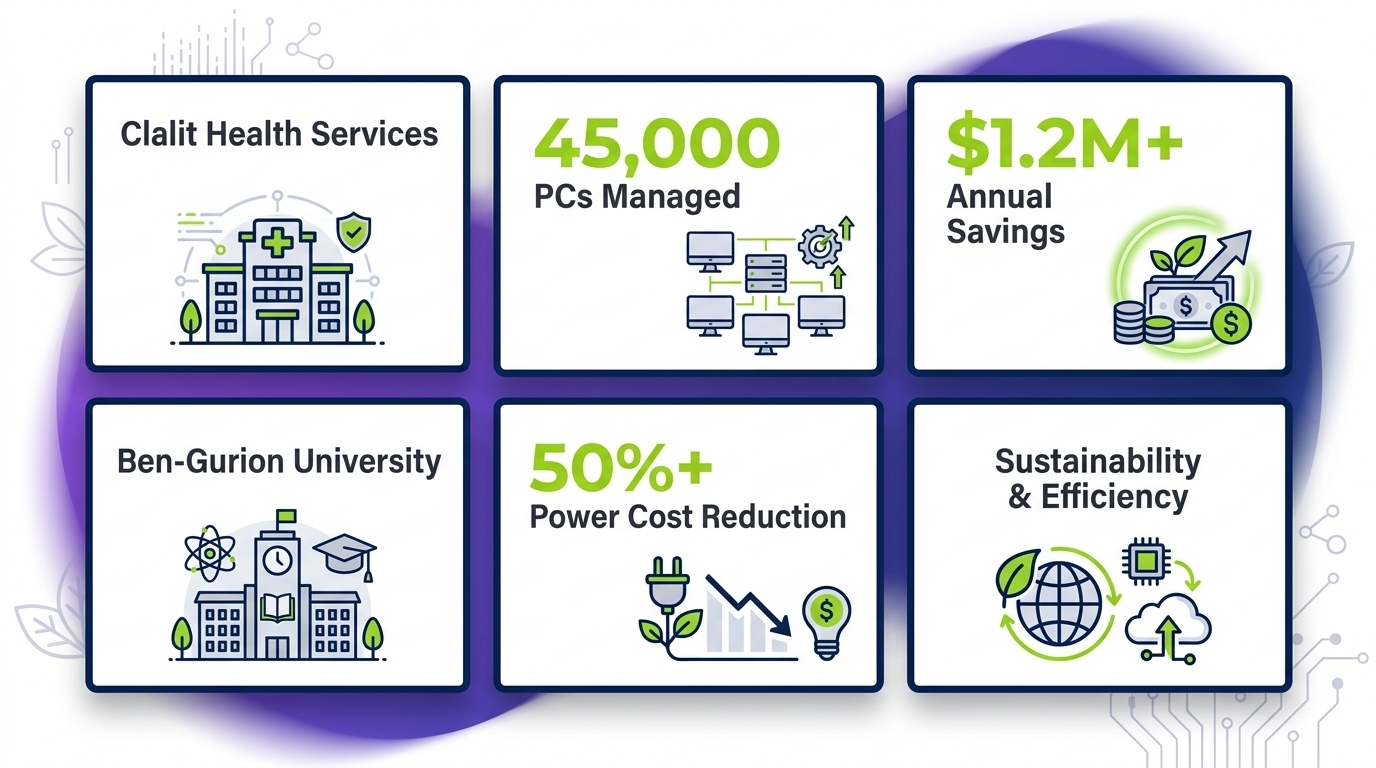
Rate optimization conversations tend to focus on servers, cooling, and building infrastructure, since those systems are the largest single consumers. But in organizations with hundreds or thousands of desktops, laptops, and monitors, the aggregate draw from that endpoint fleet is a meaningful and often continuous load — one that keeps drawing power overnight, on weekends, and during idle periods if left unmanaged.
Because endpoint power draw is distributed across many individual devices rather than concentrated in one facility meter, it is easy for it to be excluded from a rate audit entirely. Bringing endpoint fleet data into the same analysis as data center and facility load gives a more complete picture of where reducible and shiftable consumption actually sits, and where power management policies can lower both total usage and peak demand contribution.
Metrics and Checks: Calculating Your Effective Rate
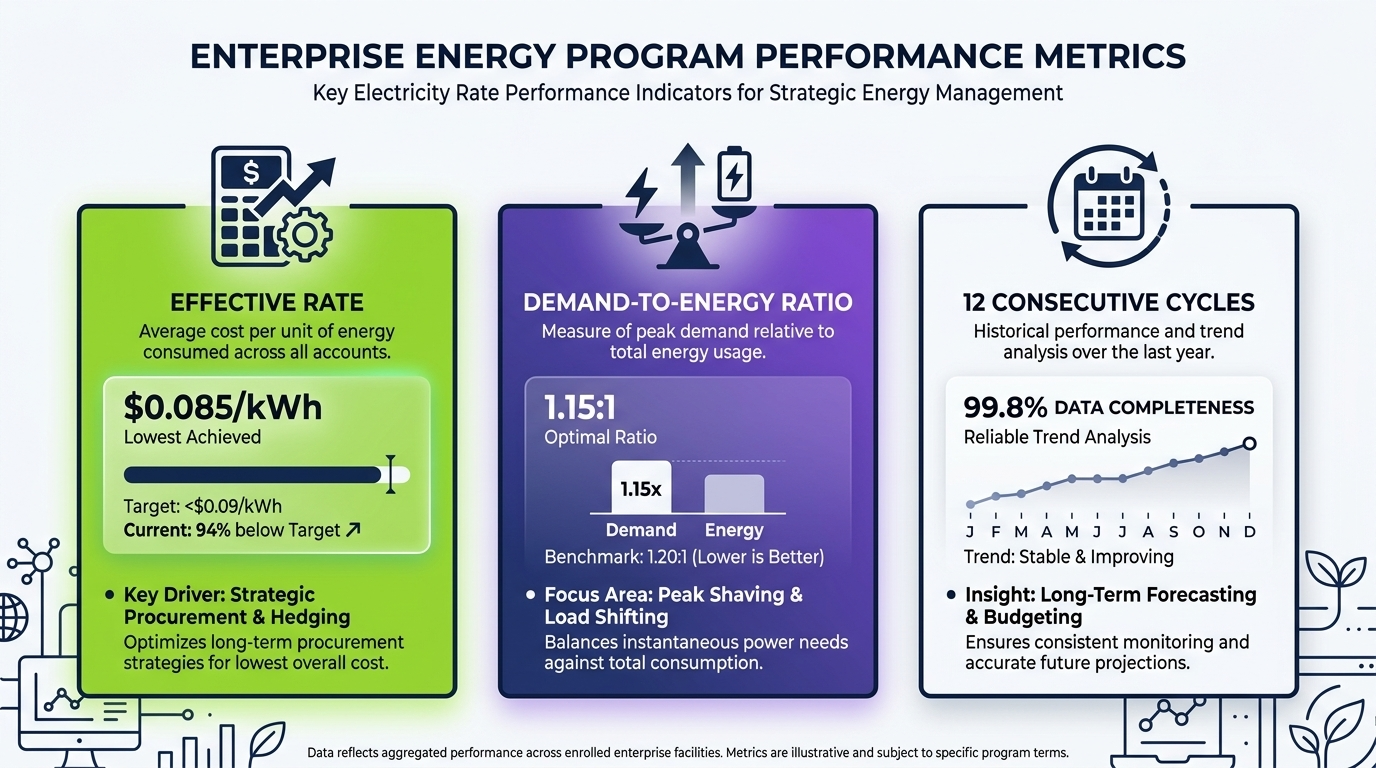
The nameplate rate on a utility contract and the effective rate an organization actually pays are rarely the same number once demand charges and time-of-use multipliers are factored in. Tracking the effective rate — total bill divided by total kWh consumed — over time is a simple way to see whether optimization work is translating into real results, independent of any single negotiated tariff.
| Metric | What It Measures | Why It Matters |
|---|---|---|
| Nameplate rate | The published per-kWh commodity rate in the contract | Starting point only — does not reflect demand or time-of-use impact |
| Peak demand (kW) | Highest recorded draw within a billing cycle | Often drives a large share of the bill independent of total kWh |
| Time-of-use exposure | Share of consumption falling inside peak-priced windows | Shows how much load is priced at the most expensive tier |
| Effective rate | Total bill divided by total kWh consumed | The true blended cost, useful for tracking optimization progress |
What is electricity rate optimization for data-heavy organizations?
It is the practice of analyzing utility rate structures — commodity charges, demand charges, and time-of-use pricing — against actual usage patterns, then adjusting scheduling, load, and endpoint behavior to lower the effective rate paid, rather than simply negotiating the published tariff.
Why do demand charges matter more than the per-kWh rate?
Demand charges are based on the single highest peak draw during a billing cycle, so a short spike can raise costs disproportionately even if total consumption for the month is unchanged. Reducing peak spikes, rather than only total usage, is often the more direct lever.
How often should a rate optimization audit be repeated?
Because utility tariffs and internal usage patterns both change, most organizations benefit from re-running the audit workflow annually, or after any significant change in headcount, device fleet size, or facility footprint.
Why include PC and endpoint fleets in a rate analysis?
Endpoint devices run continuously across many locations and are easy to overlook in a facility-level rate review. Because they contribute to both total consumption and peak demand, including them gives a more complete and accurate view of reducible load.
Bring Fleet-Wide Power Data Into Your Next Rate Review
PowerPlug gives enterprise IT teams visibility into PC and endpoint power consumption, so electricity rate optimization decisions are grounded in real fleet data rather than estimates.
Talk to Our TeamEnterprise PC Power Management
PowerPlug helps enterprise IT and operations teams manage power consumption across PC and endpoint fleets at scale, turning device-level usage data into the visibility organizations need for smarter energy and cost decisions.