ROI of PC Power Management Solutions
A rigorous framework for enterprise leaders to quantify, project, and realize the full financial and operational return from structured PC power management programs.
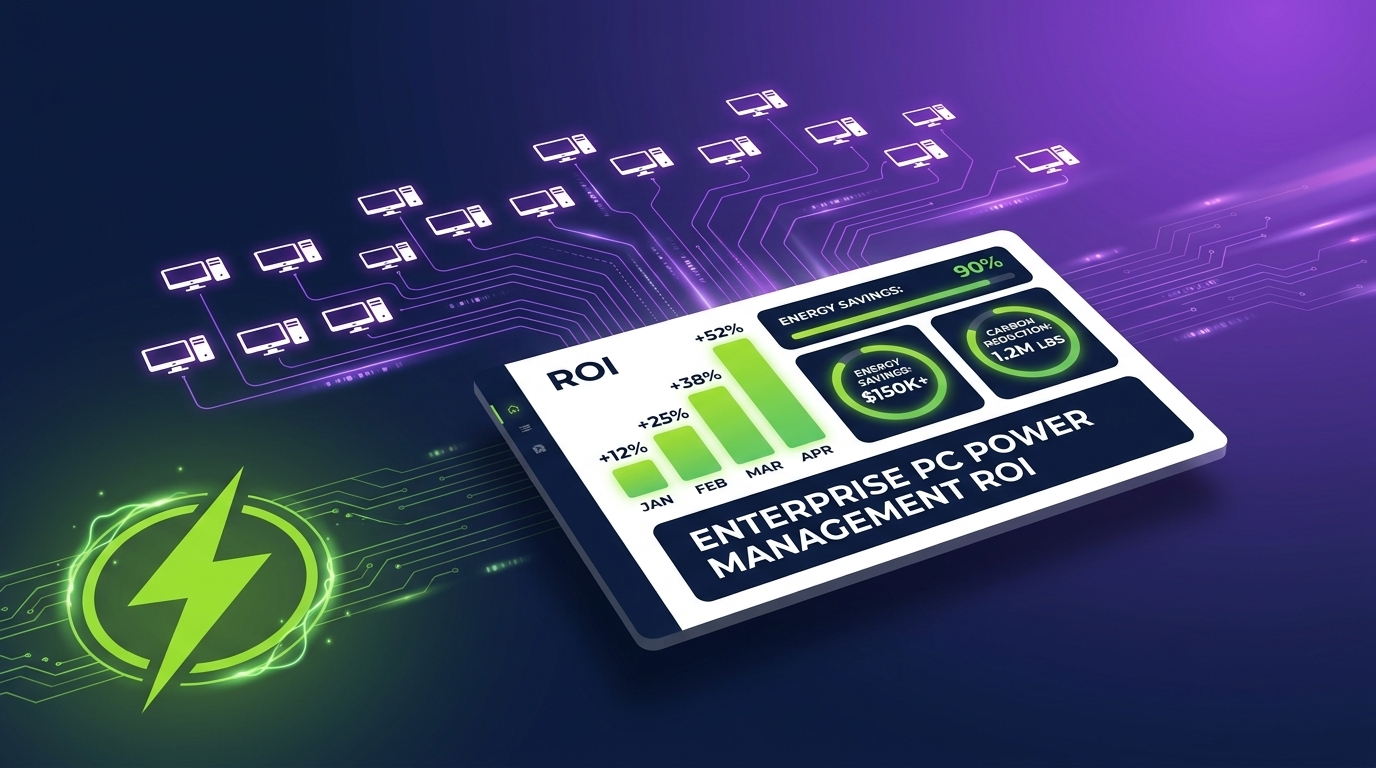
PC power management has matured from a compliance checkbox into a measurable profit lever. For enterprise operations and IT finance teams, the real question is no longer whether to act — it is how to build an accurate, defensible ROI model that captures every dollar saved, every risk reduced, and every operational gain delivered across thousands of endpoints.
Article Navigation Table of Contents
Key Takeaways
- ROI from PC power management spans energy savings, hardware life extension, IT labor reduction, and carbon compliance value.
- Accurate ROI modeling requires capturing both direct electricity costs and quantified indirect benefits.
- Automated, policy-driven platforms consistently outperform manual and OS-native approaches on measurable outcomes.
- Common projection errors — idle-time miscalculation, missing wake-on-LAN costs, ignoring variability — routinely overstate or understate real returns.
- Deployment speed and policy tuning are the primary levers for compressing payback period below 12 months.
Understanding the Full ROI Landscape
Most organizations initially approach PC power management as an electricity cost problem. That framing captures only part of the value. A rigorous ROI analysis covers four distinct categories of return:
1. Direct Energy Cost Reduction
The most visible return: reducing the kilowatt-hours consumed by desktops, workstations, and monitors during idle periods, overnight hours, and weekends. For a 1,000-endpoint estate consuming an average of 120W per station, unmanaged power states can waste 60–80% of that draw outside active hours.
2. Hardware Asset Life Extension
Thermal cycling — the repeated heating and cooling of components as machines power on and off — is a primary driver of early hardware failure. Structured sleep and shutdown policies reduce thermal stress, measurably extending mean-time-between-failure (MTBF) for CPUs, storage, and power supply units. Even a 10% increase in device lifespan across a 5,000-unit fleet represents a material deferral of capital expenditure.
3. IT Operations Efficiency
Automated power policies reduce the volume of patch deployment failures caused by machines in unmanaged states, lower after-hours IT call volume, and free technician time previously spent troubleshooting power-related incidents. Remote wake capabilities — when correctly implemented — eliminate physical desk visits for maintenance windows.
4. ESG and Regulatory Compliance Value
Scope 2 carbon reduction from PC fleets is increasingly material for organizations subject to GHG reporting frameworks, CSRD obligations, or voluntary science-based targets. Verified reduction data from power management platforms provides audit-ready carbon accounting inputs, reducing external assurance costs and supporting public sustainability commitments.
Direct Energy Savings: The Core Financial Driver
Energy savings are the most straightforward component to calculate and the most defensible in budget presentations. The following framework provides the calculation structure used by enterprise energy and IT finance teams.
The Savings Calculation Model
The foundational formula for annual per-endpoint electricity savings is:
Where Wattage Reduction is the difference between the device’s active or idle draw and its managed sleep/shutdown draw; Managed Hours per Year represents non-active hours covered by policy; and Local kWh Rate reflects blended commercial electricity pricing, inclusive of demand charges where applicable.
Baseline Assumptions for Enterprise Modeling
| Parameter | Conservative Estimate | Mid-Range Estimate | Aggressive Estimate |
|---|---|---|---|
| Idle draw (desktop + monitor) | 80W | 110W | 140W |
| Managed (sleep) draw | 5W | 5W | 5W |
| Non-active hours per year | 4,200 | 5,500 | 6,800 |
| Commercial kWh rate | $0.10 | $0.14 | $0.18 |
| Annual savings per endpoint | ~$31 | ~$58 | ~$103 |
Scaling to Fleet Level
For a 3,000-endpoint enterprise at mid-range assumptions, annual energy savings reach approximately $174,000 before accounting for demand-charge reductions and renewable energy credit (REC) value. At scale, this figure alone typically justifies the platform investment within six to twelve months.
Demand Charges and Peak Avoidance
In commercial electricity tariffs, demand charges — billed on peak kW draw during a billing period — often constitute 30–50% of the total electricity bill. Coordinated shutdown or sleep policies that reduce simultaneous endpoint load during peak demand windows generate savings beyond the per-kWh rate, sometimes doubling the effective energy ROI for large-footprint facilities.
See How PowerPlug Models ROI for Your Fleet
PowerPlug’s platform provides real-time consumption analytics, policy simulation, and automated reporting — so your ROI case is always grounded in verified data, not estimates.
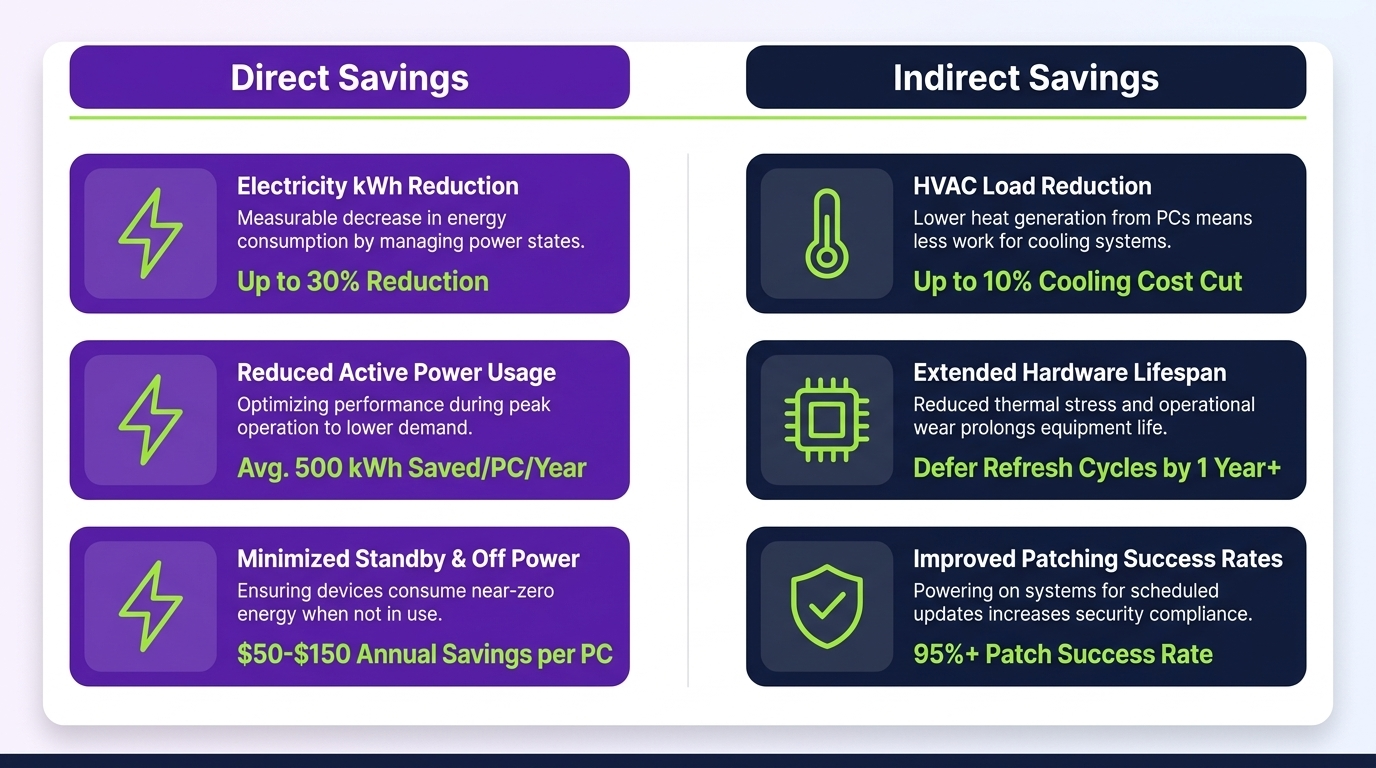
Indirect and Operational ROI Streams
Beyond electricity, a well-constructed ROI model captures the following quantifiable operational benefits. Each should be assigned a conservative dollar value and included in the total return calculation presented to finance stakeholders.
Hardware Lifecycle Value
Enterprise PCs have a typical managed lifecycle of 4–5 years. Each additional year of serviceable life defers refresh capital expenditure. Assuming an average replacement cost of $1,200 per endpoint and a realistic 8–12% lifespan extension attributable to reduced thermal cycling, the deferred CapEx value per endpoint over a three-year management window is approximately $96–$144.
IT Labor Cost Reduction
Power-related IT incidents — failed patch deployments, helpdesk calls about hibernation issues, manual wake procedures — consume measurable technician time. Automated power management with intelligent wake-on-LAN and policy exception handling reduces this category of labor. For organizations with fully loaded IT labor costs of $65–$90 per hour, even a 15-minute per-endpoint-per-year reduction represents significant aggregate savings at scale.
Patch and Compliance Window Success Rates
Patch deployment success rates are directly correlated with the ability to reliably wake, patch, and return endpoints to a managed power state. Organizations using automated power management report measurable improvements in first-attempt patch success rates, reducing the costly remediation cycles that follow failed deployment windows.
Carbon Credit and ESG Reporting Value
While carbon credit markets vary by jurisdiction, organizations subject to mandatory or voluntary carbon accounting frameworks can assign value to verified Scope 2 reductions. For a 5,000-endpoint fleet achieving a 40% consumption reduction, annual CO₂e savings may reach 200–400 tonnes — a figure with both market value and strategic reporting significance.
| ROI Category | Measurability | Typical Value Range (per endpoint/year) |
|---|---|---|
| Direct energy savings | High — metered data | $30–$103 |
| Hardware life extension | Medium — actuarial modeling | $32–$48 (amortized) |
| IT labor reduction | Medium — time-tracking data | $8–$22 |
| Patch success improvement | Medium — deployment logs | $5–$18 |
| Carbon compliance value | Variable — jurisdiction-dependent | $2–$15 |
Building a Defensible ROI Model
A credible ROI model must withstand scrutiny from finance, procurement, and sustainability leadership simultaneously. The following structure provides a framework that satisfies each audience.
Step 1: Establish Verified Baseline Consumption
ROI projections based on assumed or vendor-supplied consumption estimates are vulnerable to challenge. Begin with metered or sub-metered baseline data from a representative sample of endpoints. Where direct metering is unavailable, use manufacturer TDP specifications combined with empirical idle-draw measurements from a pilot group of 50–100 devices.
Step 2: Define Policy Scenarios and Coverage Rate
Not all endpoints in a fleet are equally eligible for aggressive power policies. Kiosk machines, trading terminals, clinical workstations, and always-on servers require policy exceptions. Model savings only against the portion of the fleet where policies will realistically be enforced — typically 65–85% of total endpoints in a mixed enterprise environment.
Step 3: Assign Conservative Values to Indirect Benefits
Use the lower bound of your estimated ranges for hardware, labor, and compliance benefits. Finance teams will accept conservative projections more readily than optimistic ones, and actual results that exceed conservative projections strengthen the case for future investment.
Step 4: Model Three Scenarios
Present base-case, conservative, and optimistic scenarios. In each, include total 3-year net benefit, payback period, and NPV at a discount rate appropriate to your organization’s cost of capital. Sensitivity analysis on kWh rate and policy coverage percentage demonstrates model robustness.
Step 5: Define Measurement and Reporting Cadence
A defensible ROI model includes a post-deployment measurement plan. Specify the reporting frequency (monthly or quarterly), the data sources (platform analytics, utility bills, IT service desk metrics), and the responsible parties. Organizations that commit to measurement accountability before deployment report significantly higher stakeholder confidence in results.
Comparing Approaches to PC Power Savings
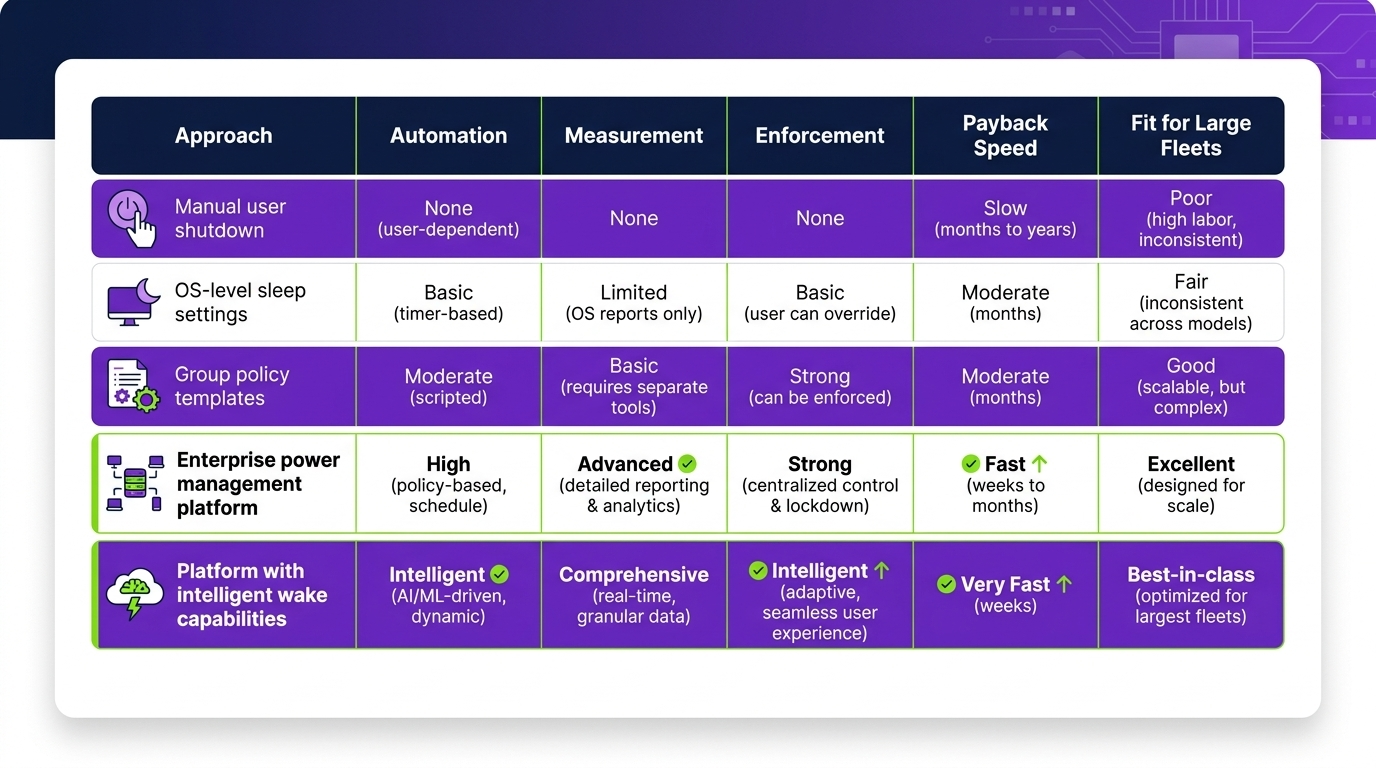
Not all power management implementations deliver equivalent returns. The approach chosen has a material impact on both the magnitude and consistency of savings achieved.
| Approach | Coverage & Consistency | Savings Potential | IT Overhead | Reporting Quality |
|---|---|---|---|---|
| OS-native settings (Group Policy) | Moderate — frequently overridden | Low–Medium | High | None |
| Manual IT enforcement | Low — inconsistent application | Low | Very High | None |
| Endpoint management add-ons (SCCM/Intune scripts) | Medium — limited policy logic | Medium | Medium | Limited |
| Dedicated power management platform | High — policy-enforced, exception-aware | High | Low | Full — audit-ready |
Why Dedicated Platforms Outperform
Purpose-built PC power management platforms deliver superior ROI for three structural reasons. First, they enforce policies at the endpoint level regardless of user overrides, maintaining savings consistency across the fleet. Second, they provide intelligent scheduling that aligns power states with patch windows, shift patterns, and operational calendars — avoiding productivity disruption that causes user resistance and policy rollbacks. Third, they generate verified, tamper-resistant consumption data that underpins both internal reporting and external sustainability disclosure.
Organizations that replace manual or OS-native approaches with dedicated platforms typically observe 35–60% greater savings realization against their projected baselines.
Common Mistakes That Undermine ROI Projections
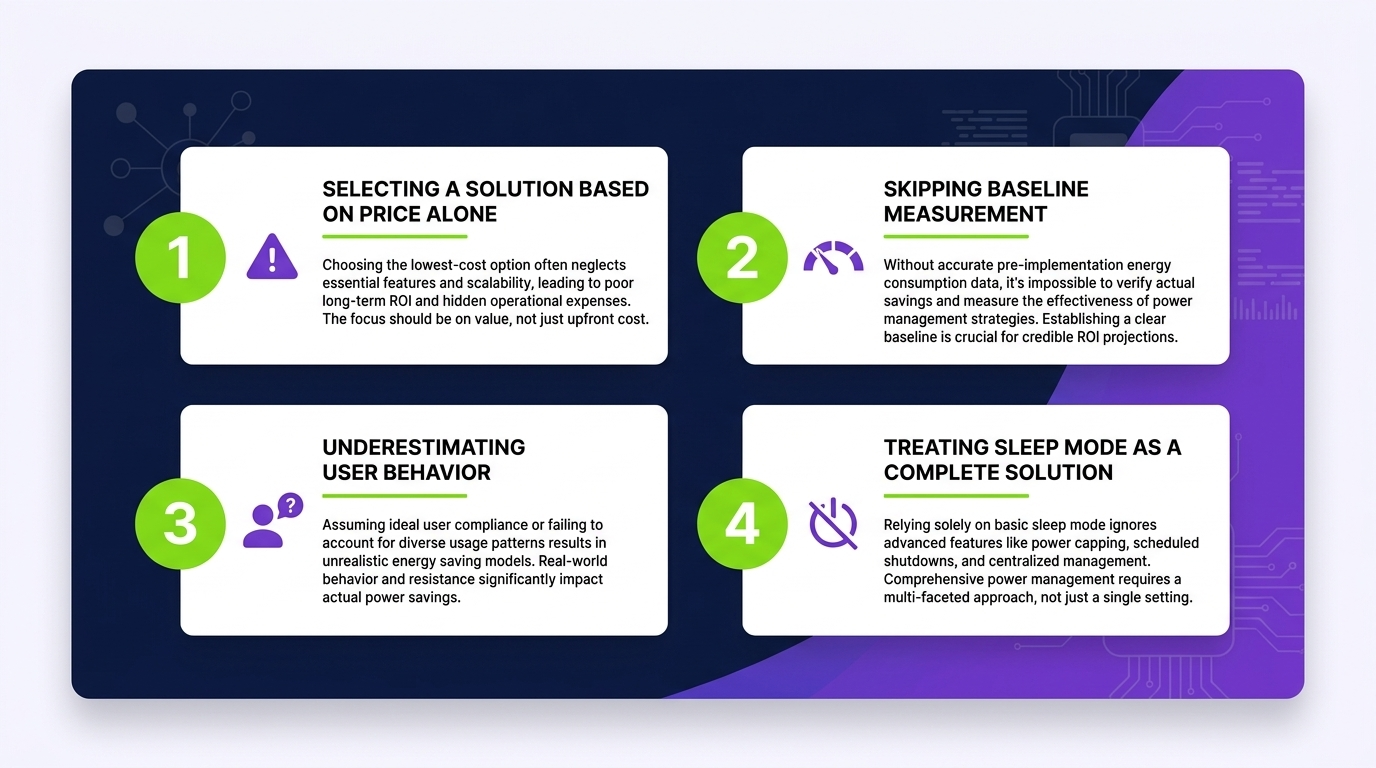
Even well-intentioned ROI models frequently contain structural errors that produce results that cannot be reproduced in practice. The following mistakes are among the most prevalent in enterprise power management business cases.
Overestimating Idle Hours
Many models assume endpoints are idle for all non-business hours — roughly 5,800 hours per year for a standard Monday–Friday operation. In practice, user behavior, scheduled tasks, and background processes mean fewer hours are genuinely available for managed power states. A realistic model applies a 70–80% realization factor to theoretical idle hours.
Ignoring Wake-on-LAN Energy Costs
Wake-on-LAN operations consume power — both during the wake event and in the extended active state that follows. Models that calculate savings purely from shutdown hours without accounting for the energy cost of scheduled and ad-hoc wake operations overstate net savings by 5–15%. Dedicated platforms with intelligent scheduling minimize unnecessary wakes, improving net efficiency.
Using Peak Wattage Instead of Measured Draw
Device TDP figures represent maximum draw, not typical operational draw. Using peak wattage in the baseline systematically inflates projected savings. Measured idle draw — typically 60–80% of TDP for desktop workstations — produces more accurate and more defensible projections.
Applying a Single Policy Across a Heterogeneous Fleet
A fleet containing desktops, laptops, workstations, and thin clients has meaningfully different power profiles. A single assumed wattage across a mixed fleet produces a blended figure that underestimates savings on high-draw endpoints and overestimates on low-draw endpoints. Segmented modeling by device class produces more accurate total projections.
Omitting User Resistance and Policy Rollback Risk
Power policies that disrupt productivity — unexpected sleep during active use, wake failures before meetings — generate user resistance that leads to policy exceptions and rollbacks. This risk should be modeled as a sensitivity variable: what is the savings impact if 15% of endpoints have policies reverted within six months? Platforms with user-awareness features and soft-policy modes significantly reduce this risk.
Accelerating Time-to-Value
Payback period is a critical metric for technology investment approval. For PC power management platforms, time-to-value is primarily driven by three factors: deployment speed, policy coverage breadth, and savings measurement visibility.
Phased vs. Full-Fleet Deployment
Organizations that deploy to the full fleet in a single phase achieve payback fastest — often within the first billing cycle for very large estates. Phased deployments, while operationally lower-risk, extend payback periods and delay the savings data needed to validate and expand the business case. Where possible, prioritize broad initial deployment even at the cost of simplified initial policy sets.
Establishing Early Measurement Wins
The first 90 days of a deployment should be designed to generate compelling measurement data. Configure reporting to capture before-and-after consumption comparisons at the building, floor, or department level. Visible early results accelerate internal advocacy and simplify budget renewals.
Policy Tuning for Maximum Coverage
Default power policies deliver partial savings. The highest-ROI deployments invest in policy tuning sessions in the first 30–60 days post-deployment: identifying exception categories, adjusting sleep timers to align with operational patterns, and verifying wake-on-LAN reliability across the infrastructure. This tuning investment typically adds 20–35% to realized savings versus default configurations.
Integrating with Existing ITSM and Energy Management Systems
Power management platforms that integrate with existing ITSM tools (ServiceNow, Jira Service Management) and energy management systems enable automated incident correlation and consolidated reporting. This integration reduces the IT labor required to manage the platform and strengthens the evidence base for ongoing ROI claims.
- Deploy to the broadest feasible scope in Phase 1 to accelerate savings realization.
- Configure before-and-after reporting within the first two weeks of deployment.
- Conduct a formal policy tuning review at Day 30 and Day 60.
- Integrate consumption data with utility billing data for full-picture ROI visibility.
- Identify and quantify IT labor savings in the first quarterly review.
Build Your Enterprise Power Management ROI Case
PowerPlug provides the platform, analytics, and expertise to help enterprise teams model, deploy, and verify PC power management ROI — from first projection to audit-ready sustainability reporting.
Frequently Asked Questions
What is a realistic payback period for an enterprise PC power management deployment?
For most enterprise deployments covering 1,000 or more endpoints, payback periods of 6–12 months are achievable based on energy savings alone. When indirect benefits — hardware lifecycle, IT labor, and compliance value — are included in the calculation, effective payback periods compress further. Organizations in regions with higher commercial electricity rates or larger fleets typically achieve payback within 6 months.
How do I calculate ROI for a mixed fleet of desktops, laptops, and workstations?
Segment your fleet by device class and calculate savings for each segment using measured or class-average idle draw figures. Desktops and workstations typically offer the largest per-device savings due to higher idle wattage. Laptops offer lower per-device savings but still contribute meaningfully at scale. Sum the segmented results for a total fleet projection and apply a 15–20% conservative adjustment to account for policy coverage variability.
Does PC power management interfere with IT patch deployment windows?
Not when correctly configured. Purpose-built power management platforms include wake-on-LAN scheduling and patch-window awareness that ensure endpoints are powered on and available during maintenance windows, then returned to managed power states afterward. This approach actually improves patch deployment success rates by ensuring consistent endpoint availability compared to unmanaged environments.
How do I account for PC power management savings in Scope 2 carbon reporting?
Verified consumption data from a dedicated power management platform provides the baseline and post-deployment consumption figures required for Scope 2 market-based or location-based accounting under the GHG Protocol. The reduction in kWh consumed translates to a CO₂e reduction using the appropriate regional electricity emission factor. For organizations subject to CSRD or other mandatory frameworks, audit-ready platform reporting substantially reduces external assurance costs.
What separates a high-performing power management deployment from an average one?
The primary differentiators are policy coverage breadth, tuning investment in the first 60 days, and integration of wake-on-LAN with operational schedules. Deployments that achieve 85%+ policy coverage across the eligible fleet and invest in schedule-aligned policy tuning consistently outperform those using default configurations by 25–40% in realized savings. Visible reporting and executive sponsorship also correlate strongly with sustained performance.
Is PC power management ROI still relevant as organizations migrate to cloud and virtual desktops?
Yes. While VDI and cloud desktop migrations reduce the physical endpoint count over time, the physical endpoints that remain — particularly high-draw workstations, dual-monitor setups, and legacy desktop estates — often represent a disproportionate share of facility energy consumption. Power management ROI remains material during and after migration transitions, and the savings data generated informs migration prioritization decisions.